

Finance does not fund training because it feels good. Finance funds training when it behaves like an investment, with a clear hypothesis, measurable leading indicators, and a credible line of sight to revenue or cost outcomes.
If you are responsible for sales enablement, customer service training, or L&D, you already know the hard part is not running training. The hard part is proving that practice changed performance enough to justify the spend.
This guide shows how to translate practice activity (like roleplay and coaching) into a CFO-ready ROI story, using a measurement plan, conservative math, and outputs your finance partner will recognize.
How finance evaluates “ROI” (and why training often loses)
Most training business cases fail for one of three reasons:
- No baseline: you cannot show improvement if “before” is unclear.
- No isolation: performance improved, but finance cannot see what caused it.
- No monetization: you can show skill gains, but cannot convert them into dollars.
Finance teams tend to trust ROI when it looks like other investments:
- A defined time horizon (for example 90 days, 6 months, 12 months)
- A measurable uplift (conversion, churn reduction, lower handling time)
- A margin or cost rate (gross margin, fully loaded labor cost)
- A payback period, and ideally a sensitivity range
Your job is to connect training to these elements without overselling attribution.
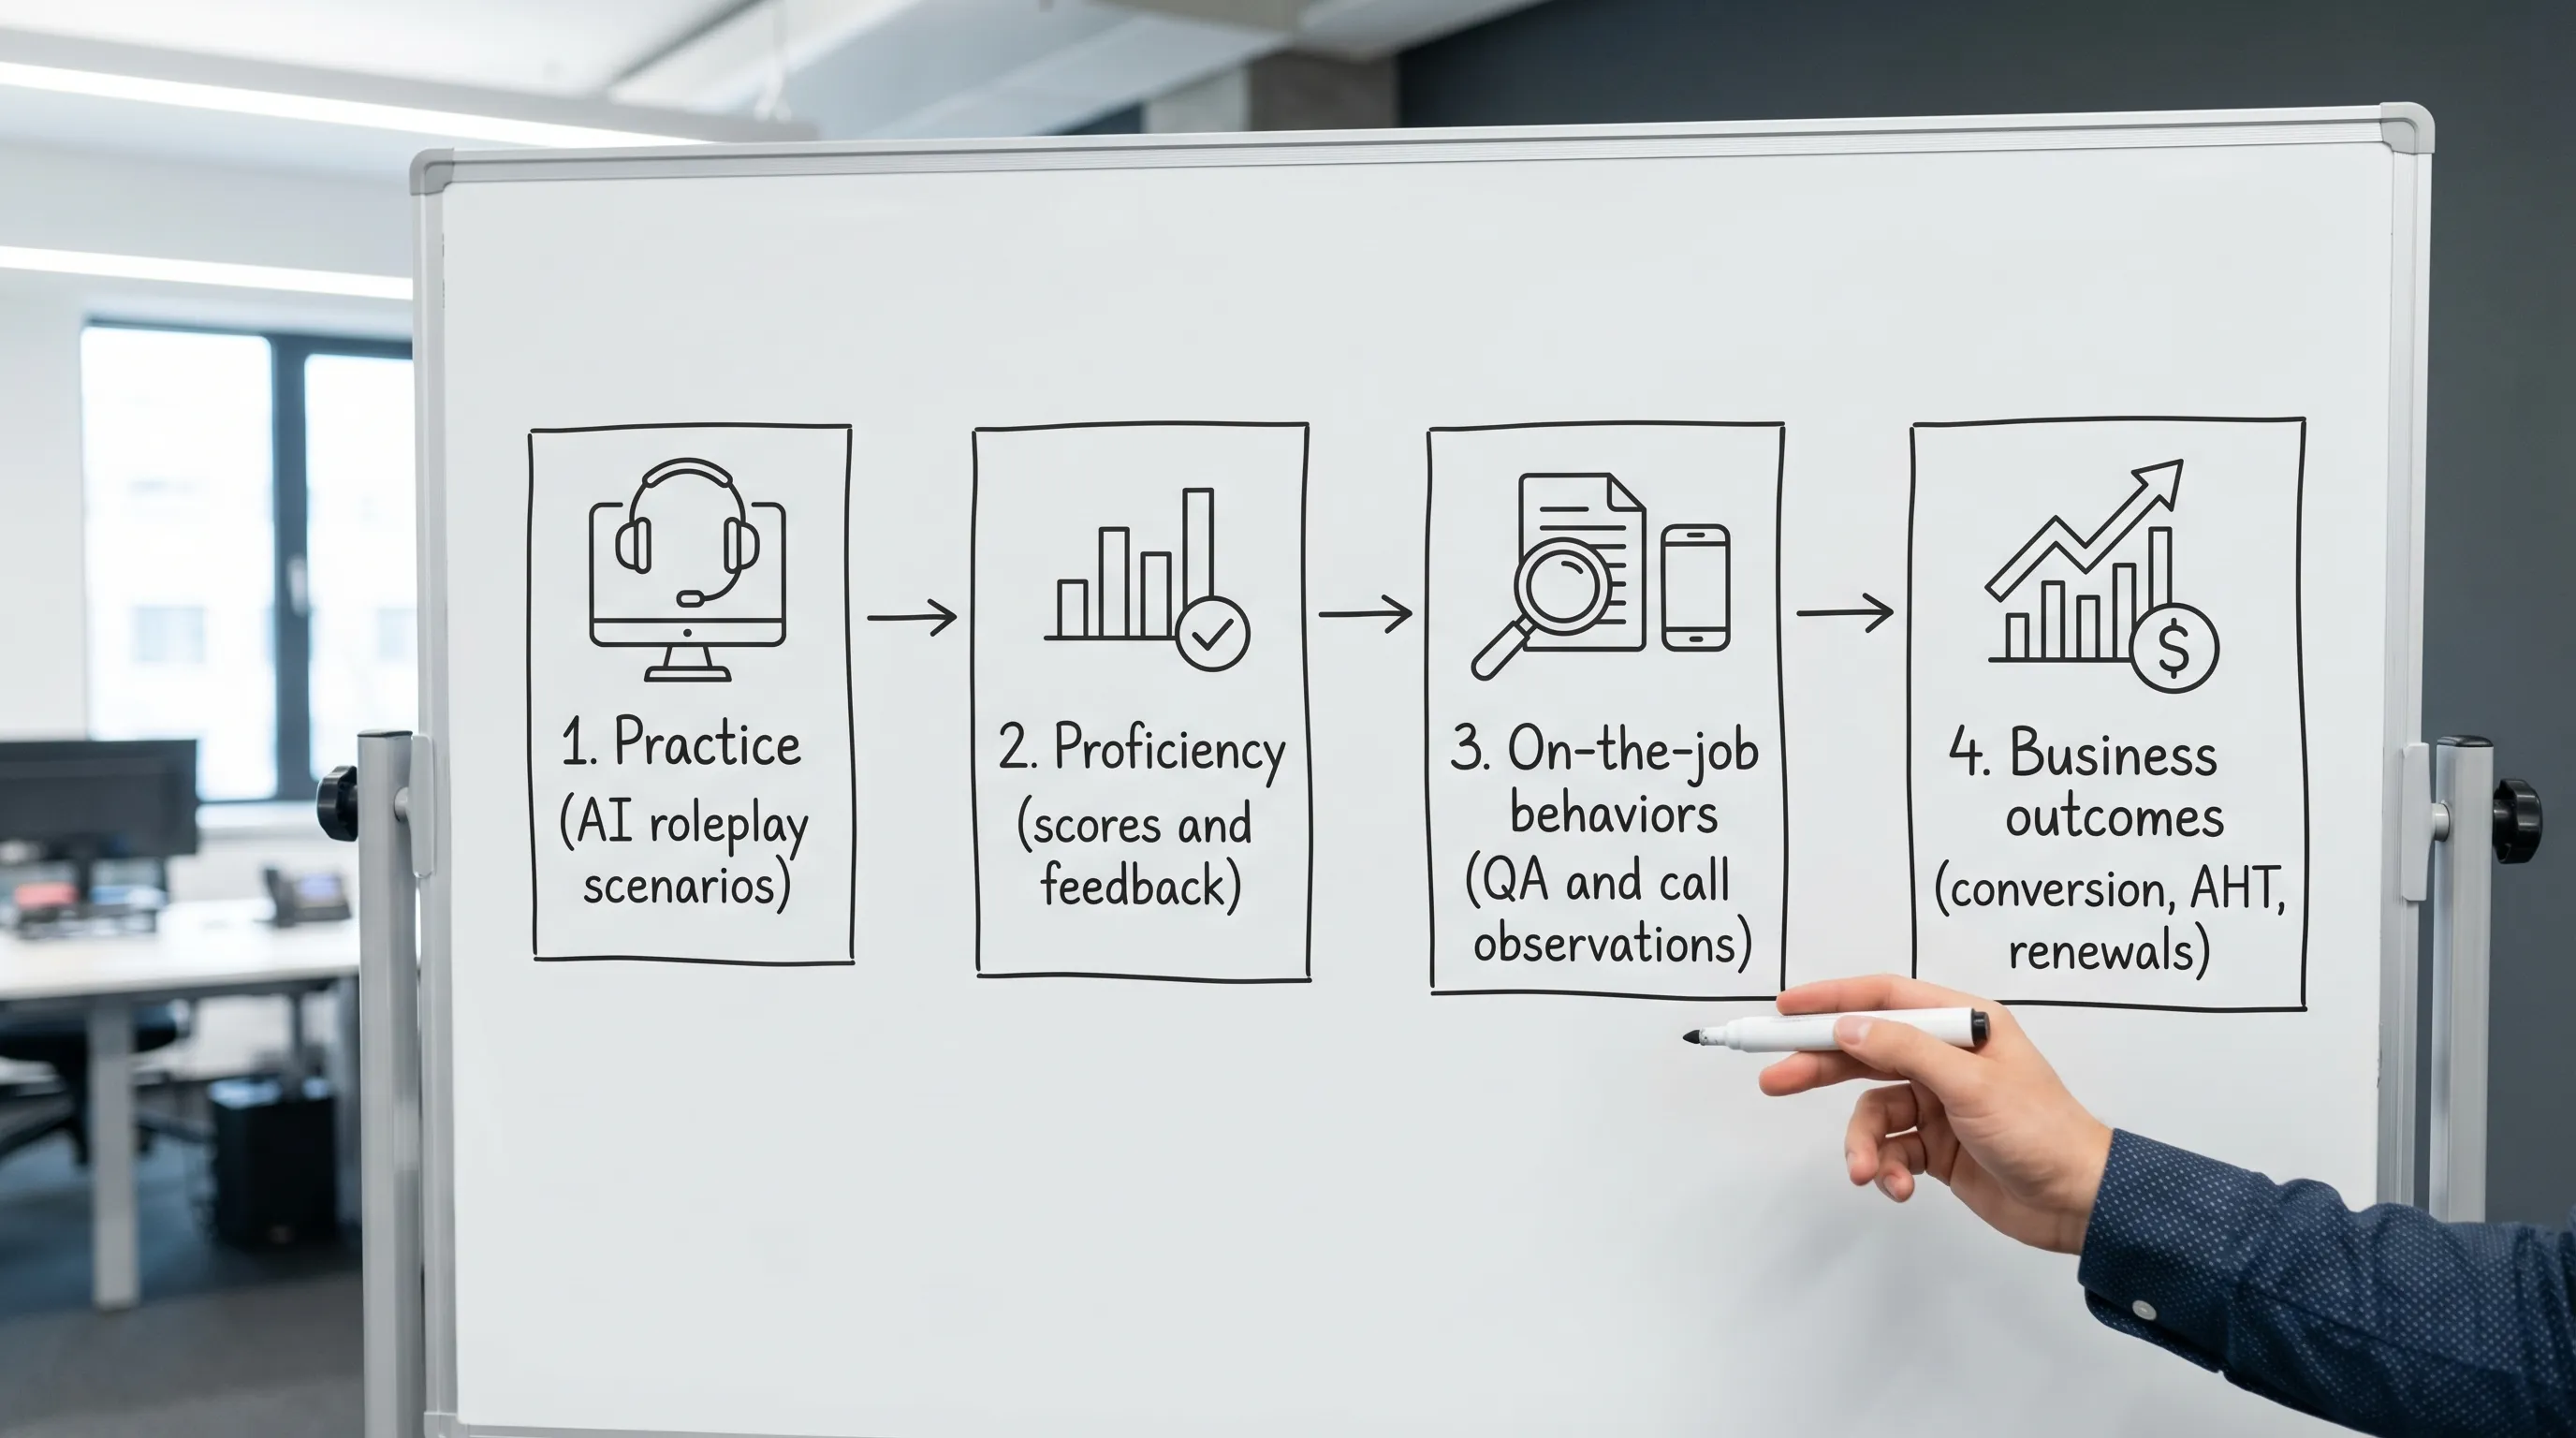
Start with the “impact chain”: Practice → Proficiency → Performance
To prove training ROI, build an impact chain that connects what your team does in training to what the business cares about.
A practical impact chain looks like this:
- Practice metrics: scenario completions, repetition, time on task
- Proficiency metrics: roleplay scoring, objection handling accuracy, rubric-based behaviors
- Performance metrics: pipeline conversion, average handle time, CSAT, renewals, revenue per rep
AI roleplay training platforms like Scenario IQ help most with the middle step, proficiency, because they can provide consistent simulations, real-time feedback, and progress tracking analytics across a team. That proficiency layer is what lets you argue that behavior changed, not just attendance.
Choose 1 to 2 “finance-grade” outcome metrics per team
Avoid trying to monetize everything. Finance will prefer one or two outcomes with clean data over ten outcomes with weak attribution.
Here are outcome metrics that usually translate cleanly to dollars:
Sales teams
- Stage-to-stage conversion rate (especially early funnel to qualified)
- Win rate (closed-won / qualified opportunities)
- Sales cycle length (shorter cycles improve cash flow and capacity)
- Ramp time to first deal (new hire productivity)
Service and support teams
- Average handle time (AHT) and after-call work time
- First contact resolution (FCR)
- Escalation rate (reduces expensive tier-2 time)
- Churn or retention (when support quality is a driver)
Cross-functional (sales + service)
- Refund rate / rework rate
- Compliance errors (where there are measurable penalties)
If you need help selecting metrics, ask finance this question: “Which two metrics, if improved by 3 to 5 percent, would you personally believe saved or made money?”
Build a measurement plan finance will accept
1) Define the baseline and the comparison window
Pick a baseline period that is long enough to smooth out randomness, often 4 to 12 weeks depending on volume.
Then define a comparison window after training that matches your sales or service cycle. A 2-week post period rarely proves anything in B2B sales.
2) Isolate training impact (without perfect science)
You have several options, listed from strongest to simplest.
Option A: Control group (best) Split similar teams or cohorts, train one group first, and delay the other group. This “holdout” design is very finance-friendly.
Option B: Staggered rollout (very practical) Roll training out by region, manager, or team over time. Compare early adopters to later adopters.
Option C: Before/after with confidence range (acceptable if you are conservative) Use a baseline, then apply a haircut (for example, credit only 50 to 70 percent of the observed uplift to training) to account for other factors.
If you can do A or B, do it. If you must do C, be explicitly conservative.
3) Decide what counts as “trained”
Finance will ask whether trained employees actually completed training.
Define clear criteria such as:
- Completed required scenarios
- Achieved a minimum proficiency threshold (for example, passing score on key behaviors)
- Maintained proficiency over time (not just a one-time spike)
This is where AI simulations and adaptive feedback can help, because you can track who practiced, what they struggled with, and whether they improved.
Turn outcomes into dollars (a CFO-ready ROI model)
Finance typically expects you to show three things:
1) Incremental benefit (profit or cost savings) 2) Total program cost 3) ROI, payback, and sensitivity
Step 1: Calculate incremental benefit
Use a simple, auditable formula.
Sales example (incremental gross profit)
Incremental gross profit = (Incremental closed-won deals) × (Average deal size) × (Gross margin)
Incremental closed-won deals = (Win rate uplift) × (Number of qualified opportunities)
Service example (cost savings)
Annual cost savings = (AHT reduction in minutes) × (Annual contact volume) × (Fully loaded cost per minute)
Where cost per minute = Fully loaded hourly cost / 60
Step 2: Count total program cost
Include:
- Platform subscription or licensing
- Internal enablement time (design, rollout, reporting)
- Learner time (hours spent practicing, valued at loaded labor rate)
- Any content development or scenario customization costs
Do not hide learner time. Finance will include it anyway.
Step 3: Compute ROI and payback
ROI (%) = (Net benefit / Total cost) × 100
Net benefit = Incremental benefit − Total cost
Payback period = Total cost / Monthly benefit
If finance prefers NPV, offer it, but ROI and payback are usually enough for training decisions.
A worked example (hypothetical numbers, show your math)
Assume a sales team runs AI roleplay training focused on discovery, objection handling, and pricing confidence.
- Qualified opportunities in 90 days: 400
- Baseline win rate: 22%
- Post-training win rate: 25% (uplift: +3 percentage points)
- Average deal size: $18,000
- Gross margin: 70%
- Total program cost for 90 days: $45,000 (platform + time)
Step 1: Incremental deals Incremental deals = 400 × 0.03 = 12 deals
Step 2: Incremental gross profit Incremental gross profit = 12 × $18,000 × 0.70 = $151,200
Step 3: Net benefit and ROI Net benefit = $151,200 − $45,000 = $106,200
ROI = ($106,200 / $45,000) × 100 = 236%
Step 4: Make it finance-credible with a haircut If you cannot isolate impact with a control group, credit only part of the uplift to training.
If you apply a 60% attribution factor:
Adjusted incremental gross profit = $151,200 × 0.60 = $90,720
Adjusted net benefit = $90,720 − $45,000 = $45,720
Adjusted ROI = 102%
That is a materially different story, and it is also the kind of conservative framing finance will respect.
Map training data to finance data in one page
Finance will ask, “Where did this number come from?” Prepare a simple map of sources and reporting cadence.
| Layer | Metric | Example data source | Reporting cadence | Why finance cares |
|---|---|---|---|---|
| Practice | Scenario completions, time in practice | Training platform analytics (for example, Scenario IQ progress tracking) | Weekly | Adoption and exposure |
| Proficiency | Roleplay scoring, objection handling rubric | AI simulation scores, manager review | Weekly to monthly | Evidence of behavior change |
| On-the-job | Call QA score, script adherence, talk tracks used | QA tooling, conversation intelligence, manager observations | Monthly | Proof training generalized |
| Business outcomes | Win rate, AHT, FCR, churn | CRM, helpdesk, finance systems | Monthly to quarterly | Monetizable impact |
This table is a quiet power move in a finance meeting because it shows governance, not vibes.
Make the story harder to argue with: sensitivity and risk controls
Use a sensitivity range
Instead of claiming “training drove $151k,” present a range:
- Low case: 40% attribution
- Base case: 60% attribution
- High case: control group validated
Finance likes ranges because that is how they model uncertainty in other investments.
Address common objections before they come up
“Seasonality improved performance.” Use year-over-year baseline, or staggered rollout.
“Top reps improved, but bottom reps did not.” Break out results by proficiency bands. If AI roleplay helps lower performers catch up, that is often a strong ROI story.
“Managers did not coach consistently.” Track manager participation and correlate coaching touchpoints to outcomes.
“Data is sensitive.” Call out enterprise security expectations. If you are using a platform like Scenario IQ that emphasizes enterprise-grade security, mention it in the governance section, and confirm data handling with your IT and legal teams.
A CFO-ready ROI narrative (template you can reuse)
Use this structure in your deck or memo:
1) Business problem: The cost of missed objections or inconsistent discovery (revenue leakage, longer handle times, churn risk). 2) Intervention: Scenario-based practice with measurable proficiency targets (AI roleplay simulations, real-time feedback). 3) Adoption and proficiency: % trained, proficiency gains, time to proficiency. 4) Business outcomes: Win rate, AHT, FCR, retention, with baseline and post period. 5) Monetization: Show formulas, margin assumptions, and attribution haircut. 6) Decision: Expand, sustain, or iterate, with a clear next measurement window.
The key is that training is not “done.” It is an operating system with a feedback loop.
Where Scenario IQ fits in a finance-proof ROI approach
To prove ROI, you need evidence in the middle of the impact chain, not just end results. Scenario IQ is designed for that middle layer:
- AI-powered roleplay simulations to create repeatable practice opportunities
- Personalised training scenarios so teams practice what actually happens in your business
- Real-time feedback and adaptive guidance to accelerate skill development
- Progress tracking analytics and performance dashboards to support measurement and coaching
- Team-focused learning so managers can reinforce behaviors consistently
Used well, this makes your ROI story more credible because you can show not only that results changed, but also how skills and behaviors changed along the way.
Frequently Asked Questions
What is the best way to prove training ROI to finance? Use one or two monetizable outcome metrics, establish a baseline, isolate impact with a control group or staggered rollout, and convert uplift into dollars with conservative assumptions.
Which training metrics do CFOs actually care about? CFOs care about metrics that translate to revenue, gross profit, or cost savings, such as win rate, sales cycle length, AHT, FCR, and churn. Training activity metrics matter only if they connect to these.
How long should I wait to measure ROI after sales training? Long enough to match your cycle. For transactional sales, 30 to 60 days can work. For longer B2B cycles, 90 to 180 days is often more defensible.
Do I need a control group to measure ROI? It is not mandatory, but it is the most finance-credible option. If you cannot run a control group, use staggered rollout or apply an attribution haircut to observed uplift.
How does AI roleplay help demonstrate ROI? AI roleplay provides consistent practice conditions and measurable proficiency signals (scoring, feedback, progress trends). That creates proof of behavior change, which strengthens the case that performance changes were caused by training.
Turn practice into a finance-approved performance engine
If you are trying to justify sales or service training spend, the fastest path is to pair a clean measurement plan with training that produces measurable proficiency data.
Explore Scenario IQ to see how AI roleplay simulations, real-time feedback, and analytics can help you connect practice to performance, and make training ROI easier to defend in your next finance review.