

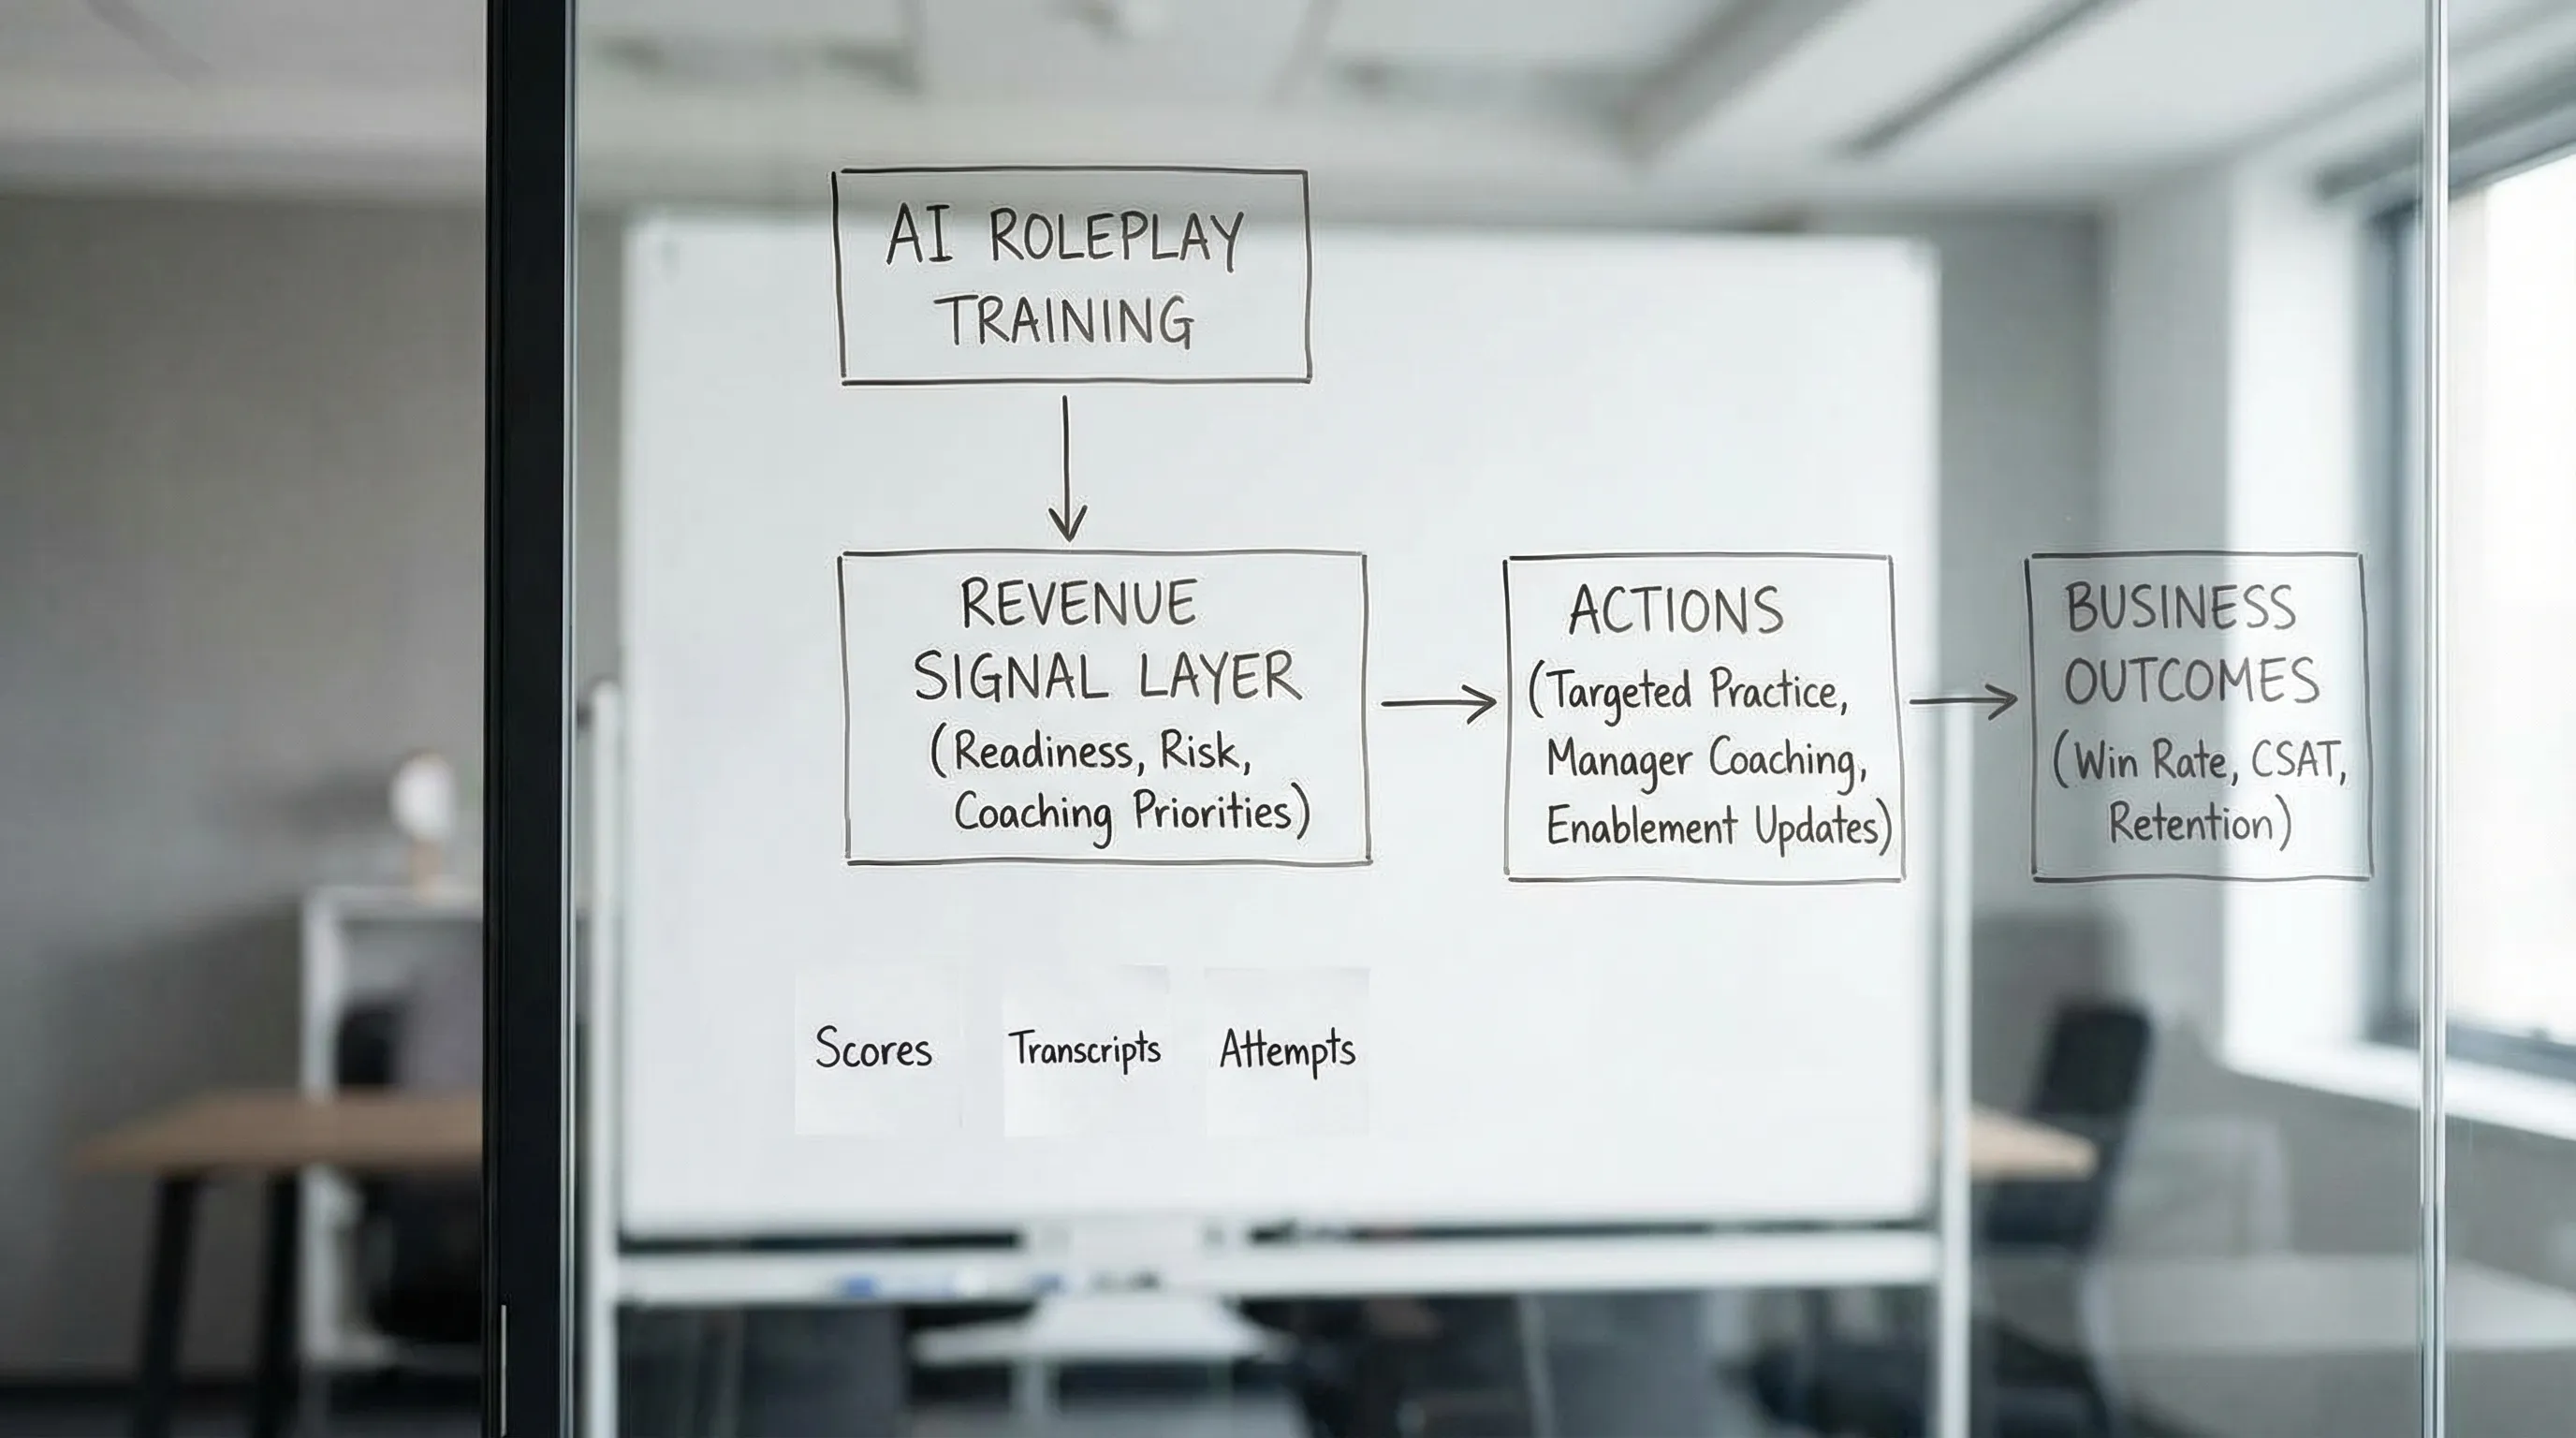
Most sales and service teams have more training data than they realize. Every roleplay attempt, objection handled, and feedback loop produces signals about readiness, risk, and revenue potential. The problem is that this data usually stays trapped inside “training completion” reports that do not change pipeline outcomes.
Data analytics AI changes that. When you treat training interactions as measurable behaviors (not just coursework), you can convert training activity into leading indicators for performance, and then act before missed quota, churn, or poor CSAT shows up.
Why training data is the missing revenue dataset
Revenue teams already measure lagging outcomes in the CRM and support tools: win rate, cycle length, renewal rate, escalations, CSAT. Those metrics are essential, but they arrive late.
Training data arrives early.
If a rep repeatedly struggles to: - open discovery cleanly, - handle pricing pushback, - explain value without feature dumping, - de-escalate an angry customer,
then you often have a measurable warning sign weeks before it impacts pipeline or retention. The opportunity is not “more training.” It is turning training behavior into an operational signal that leaders can use like any other revenue metric.
What “data analytics AI” means (in a training context)
In practice, data analytics AI for training is the combination of:
- Data capture: collecting structured and unstructured training telemetry (scores, timestamps, rubric items, transcripts, attempts, coaching notes).
- Analysis: identifying patterns across people, roles, regions, and cohorts.
- Prediction: estimating near-term performance risk or readiness (for example, who is likely to stall deals due to weak objection handling).
- Recommendation: prescribing the next best training or coaching action (not just reporting what happened).
AI is especially useful because training data is often messy. Conversations, free-text feedback, and scenario responses are hard to summarize manually at scale.
Revenue signals: leading indicators you can actually act on
A “revenue signal” is a training-derived metric that is:
- behavior-based (what someone can do, not what they watched),
- repeatable (measured consistently across time and cohorts),
- linked to outcomes (correlates with pipeline or retention KPIs),
- actionable (maps to a coaching or enablement intervention).
Think of it as the enablement equivalent of product analytics. Product teams track activation and retention events because they predict revenue. Revenue teams can do the same with training behaviors.
Training metrics vs. revenue signals
A completion rate is a training metric. It tells you consumption.
A revenue signal tells you capability, such as whether someone can navigate a pricing objection under pressure, at the right skill level, consistently.
A simple mapping: from training behaviors to business outcomes
Use the table below to translate “what we can measure in training” into “what the business cares about.” The exact definitions will differ by company, but the structure stays the same.
| Training behavior signal (leading) | What it indicates | Business outcome it can influence (lagging) | Example action |
|---|---|---|---|
| Objection-handling proficiency (pricing, competitor, security review) | Ability to protect value and progress deals | Win rate, discount rate, sales cycle length | Assign targeted objection scenarios, coach on talk tracks, re-test within 7 days |
| Discovery quality score (problem clarity, impact, next steps) | Ability to qualify and shape deals | Pipeline quality, forecast accuracy, win rate | Require a “discovery certification” before owning enterprise opps |
| Message clarity and concision | Ability to explain value quickly | Conversion rate, meeting-to-opportunity rate | Micro-coaching on positioning, practice with tighter time constraints |
| De-escalation and empathy score (service) | Ability to reduce friction and recover trust | CSAT, churn, escalations | Scenario practice for high-stress tickets, reinforce language patterns |
| Compliance and policy accuracy | Ability to stay within regulated boundaries | Risk events, QA failures | Increase guardrails, role-based scenario library, periodic recertification |
| Speed to proficiency (attempts to reach threshold) | Learning efficiency and readiness | Ramp time, quota attainment | Adjust onboarding path, add daily tips, increase guided practice |
A practical playbook: how to turn training data into revenue signals
The goal is not to build a perfect model on day one. The goal is to create a tight loop between training, performance data, and coaching actions.
Define the outcomes and the hypotheses
Start with one or two outcomes you want to improve, such as:
- win rate in a specific segment,
- reduced discounting,
- faster ramp for new hires,
- fewer escalations,
- higher renewal conversion.
Then write hypotheses that connect behaviors to outcomes. Example: “Reps who score above X on competitor objection handling in roleplay will have higher stage-to-stage conversion from evaluation to proposal.”
This step matters because AI analytics without a hypothesis tends to become a dashboard that everyone glances at and nobody uses.
Capture the right training telemetry (without drowning in data)
You do not need “all the data.” You need the data that represents real performance. High-signal inputs often include:
- scenario type (pricing pushback, renewal negotiation, angry customer, security questionnaire),
- skill level and difficulty,
- rubric-based scoring (for example, clarity, empathy, structure, policy adherence),
- attempt count and improvement rate,
- time to complete and time between attempts,
- qualitative feedback themes.
If your training includes conversation-based practice, transcripts can become a rich source of features, such as talk-to-listen balance, question depth, or missed steps in a framework.
Standardize scoring so the signal is comparable
A common failure mode is inconsistent measurement. If one manager scores harshly and another scores leniently, you have noise, not signal.
To make training analytics usable:
- use consistent rubrics by role,
- define what “good” looks like with examples,
- calibrate scoring periodically,
- track skill levels so you do not compare beginners to advanced reps.
AI can help here by applying consistent evaluation criteria across practice sessions, and by providing real-time feedback tied to the rubric.
Connect training data to business data (the right way)
Turning training data into revenue signals requires joining it with business outcomes. That does not mean you must build a complex data warehouse project immediately.
Start with a lightweight approach:
- choose a stable identifier (employee ID, email, or HRIS ID),
- align time windows (for example, training score in week 1 vs. pipeline outcomes in weeks 2 to 8),
- compare cohorts (trained vs. not trained, high proficiency vs. low proficiency).
A practical technique is lagged correlation: training improvements should come before pipeline improvements. If your “signal” only moves after revenue changes, it is probably not predictive.
Build your first “revenue signal score”
Your first version can be simple. Pick 3 to 6 behaviors that matter most for a role, weight them, and produce a composite score.
Example for an SMB AE:
- discovery quality,
- pricing objection handling,
- next-step commitment,
- product fit articulation.
Example for a support team:
- empathy and de-escalation,
- accuracy and compliance,
- resolution clarity,
- escalation judgment.
Then validate against outcomes (even if imperfect). You are looking for directional value: does higher proficiency associate with better conversion, fewer escalations, or faster ramp?
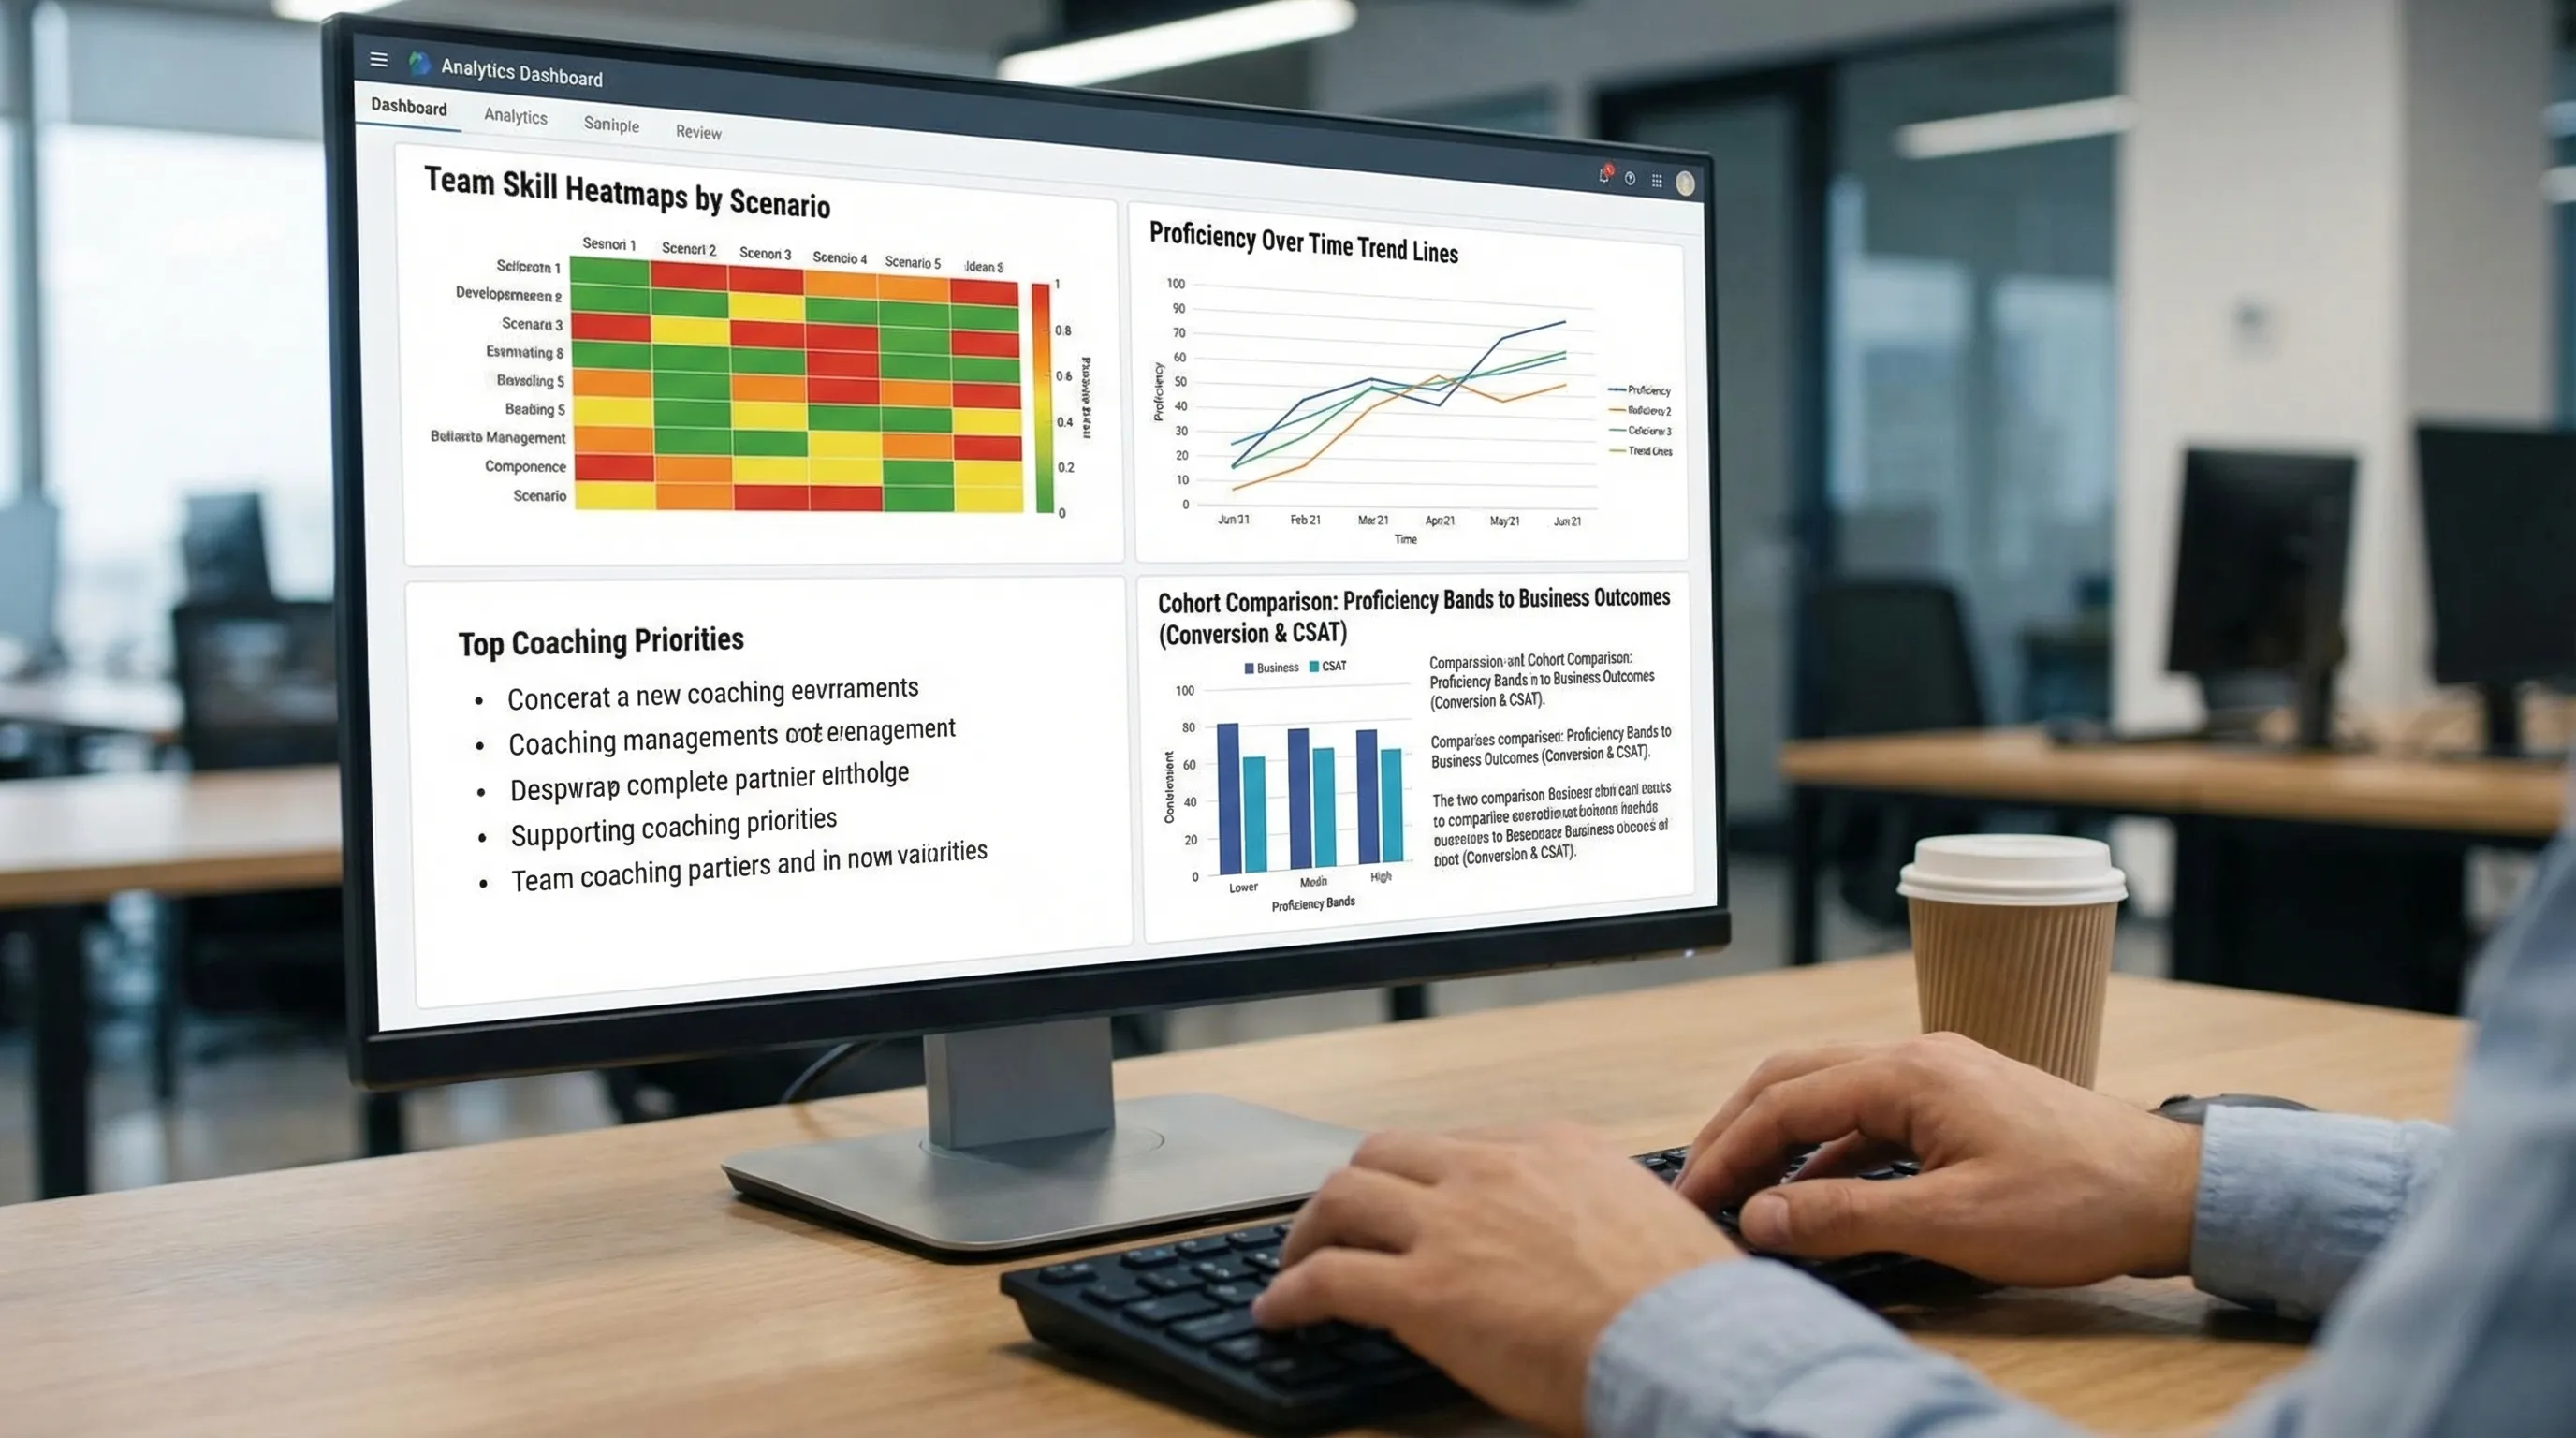
Operationalize the signal: dashboards, alerts, and coaching workflows
A revenue signal only matters if it changes behavior.
Consider three operating rhythms:
- Weekly: team-level signal review (top risks, most improved skills, scenario completion quality).
- Manager 1:1: individual coaching plan driven by signal deltas (what changed since last week).
- Enablement monthly: content and scenario updates based on aggregate failure modes.
This is where “training analytics” becomes “revenue analytics,” because the output is a decision, not a report.
A maturity model for data analytics AI in training
Most organizations evolve through stages. Knowing your stage helps you prioritize.
| Stage | What you measure | What you can answer | Common limitation |
|---|---|---|---|
| 1. Completion tracking | courses finished, attendance | “Did they do the training?” | No proof of capability |
| 2. Proficiency scoring | rubric scores, pass/fail, attempts | “Can they perform the skill in practice?” | Not tied to business outcomes |
| 3. Signal linking | cohorts, correlations, lag analysis | “Which skills predict performance?” | Requires clean identifiers and time windows |
| 4. Predictive readiness | risk scoring, ramp projections | “Who is likely to miss targets or escalate?” | Needs governance and monitoring |
| 5. Prescriptive enablement | next-best scenario, targeted coaching | “What should we do next to move revenue?” | Requires process adoption, not just analytics |
Common pitfalls (and how to avoid them)
Mistaking activity for ability
High training volume does not equal high performance. Favor scenario-based proficiency, improvement rate, and consistency under harder conditions.
Overfitting to last quarter’s problems
If you only train to last quarter’s objections, you will be late to the market. Keep a mechanism for updating scenarios based on new competitive moves, product changes, and customer sentiment.
Ignoring data privacy and governance
Training data can include sensitive information, especially if practice scenarios resemble real customer situations.
Set clear guardrails:
- define what data is collected and why,
- avoid putting real customer PII into training prompts,
- restrict access by role,
- establish retention policies.
For a useful reference on governing AI systems, see the NIST AI Risk Management Framework.
Treating analytics as a “side project”
Signals only work when they are part of the operating cadence. Decide who owns the metric (enablement, RevOps, support ops), how often it is reviewed, and what actions it triggers.
Where Scenario IQ fits
Scenario IQ is designed for organizations that want to improve sales and service performance through AI-powered roleplay training and then learn from the results.
Based on the platform capabilities, Scenario IQ can support the revenue-signal approach by enabling:
- AI roleplay simulations that generate consistent practice data
- personalised training scenarios aligned to roles and skill levels
- real-time feedback that helps learners improve in the moment
- progress tracking analytics so managers can see trends and gaps
- adaptive feedback and guidance that adjusts to performance
- daily actionable tips to reinforce behaviors between sessions
- enterprise-grade security for organizational deployment
If your current training stack tells you who completed onboarding, Scenario IQ can help you see who is actually ready, where skills are breaking down, and what to coach next.
Frequently Asked Questions
What is data analytics AI in sales and service training? Data analytics AI applies machine learning and automation to training data (scores, transcripts, attempts, feedback) to detect patterns, predict readiness or risk, and recommend targeted coaching actions.
What are “revenue signals” and why do they matter? Revenue signals are leading indicators derived from training behaviors that predict business outcomes like win rate, discounting, ramp time, CSAT, or churn. They matter because they let leaders intervene earlier.
How do you link training data to revenue without overcomplicating it? Start by aligning identifiers (employee ID or email), defining time windows (training first, outcomes later), and comparing cohorts. You can expand into deeper modeling once the basics are reliable.
Which metrics are most predictive for sales teams? It depends on the role, but commonly predictive areas include discovery quality, objection handling (pricing and competitors), value articulation, and next-step control. The key is validating the metrics against your own pipeline outcomes.
Is it safe to use AI on training conversations? It can be, if you apply strong governance: avoid real customer PII in prompts, limit access, define retention policies, and choose vendors with enterprise-grade security. Your internal policies and risk requirements should drive the design.
Turn training into an early-warning system for revenue
If you want training to show up in pipeline results, you need more than completion reports. You need data analytics AI that converts practice into proficiency, and proficiency into revenue signals your leaders can act on.
Explore how Scenario IQ can support this approach with AI roleplay simulations, real-time feedback, and progress analytics at Scenario IQ.