

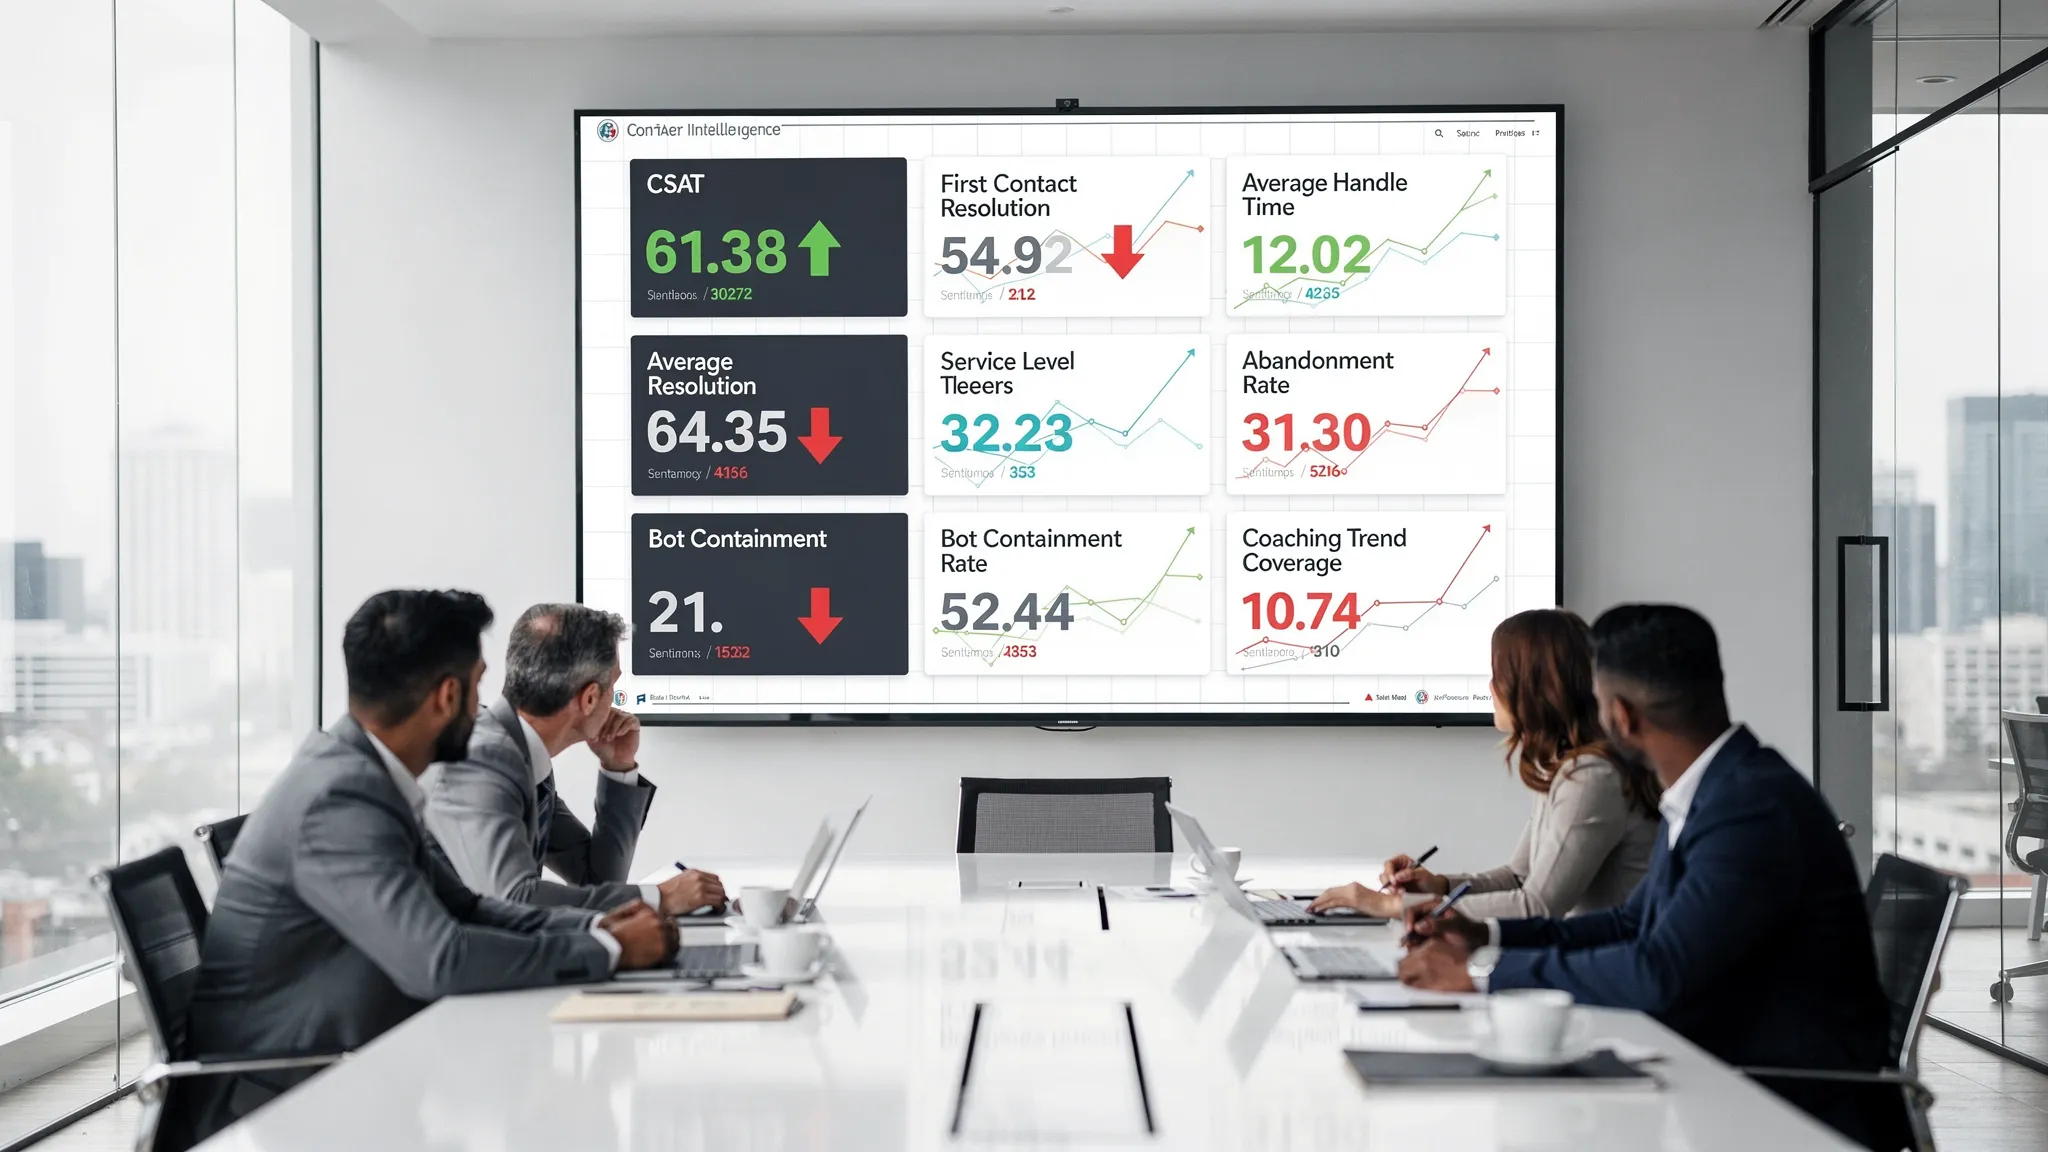
AI in the contact center moved from shiny add‑on to core operating system in 2024. In 2025, leaders are asking a sharper question, which metrics in your contact center intelligence program truly predict customer outcomes, operational efficiency, and revenue, and which are vanity? This guide distills the metrics that matter, how to calculate them, and how to use them to make better decisions week after week.
How to think about metrics in 2025
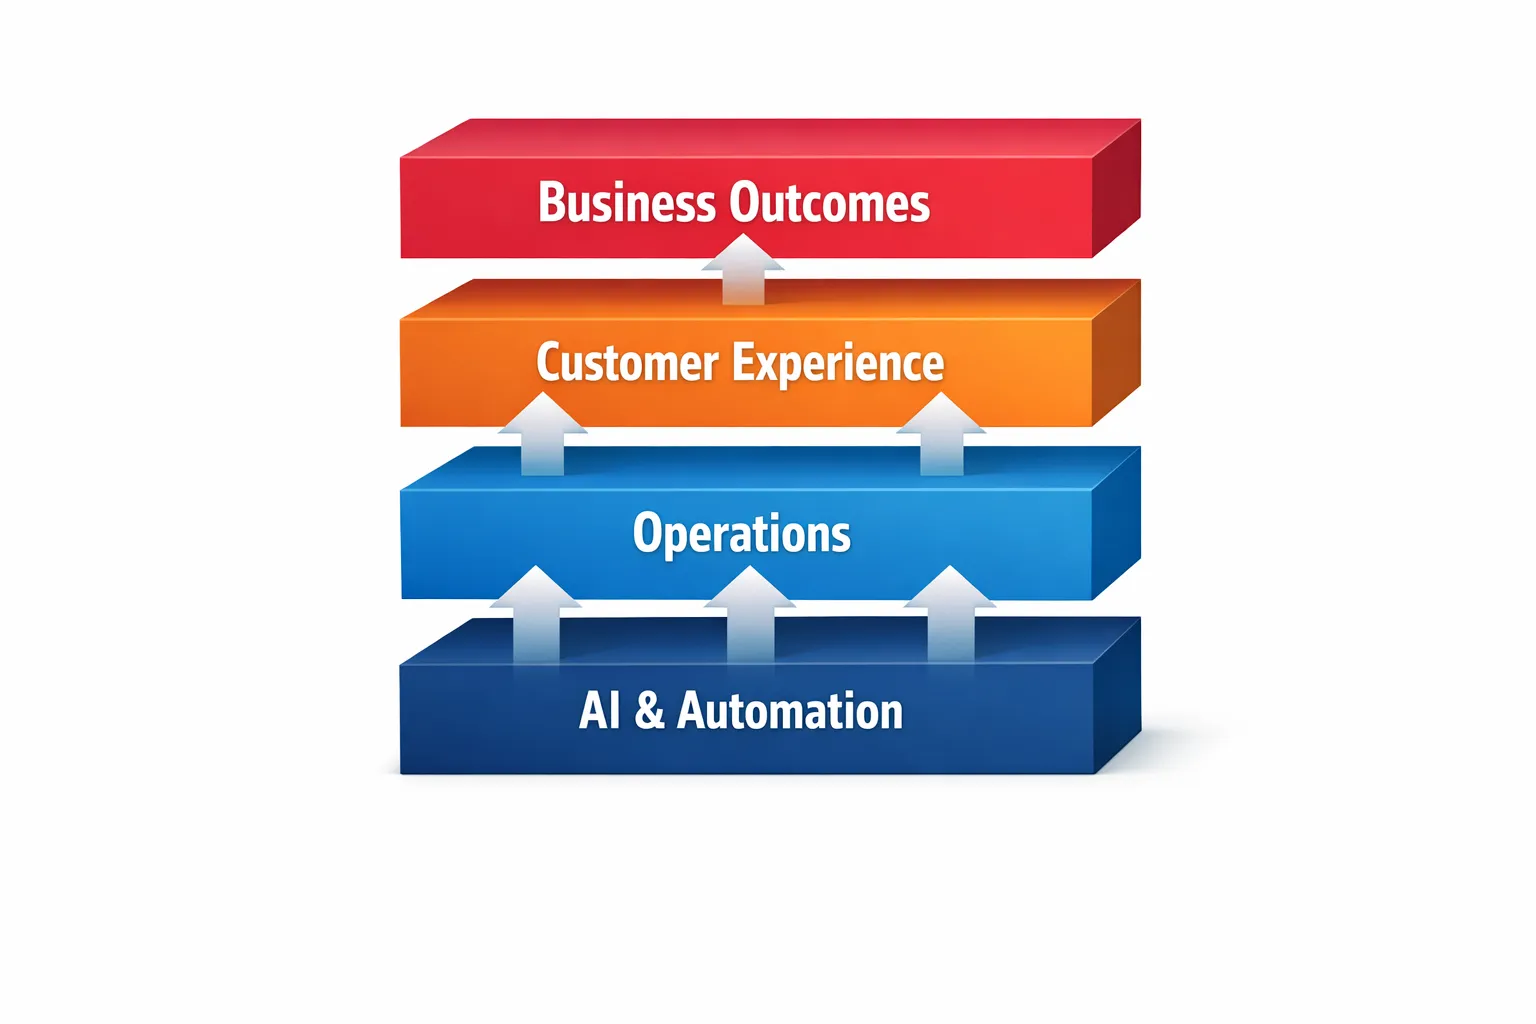
High‑performing teams connect four layers of measurement so that frontline actions roll up to executive outcomes:
- Business outcomes, revenue, retention, cost to serve per resolution
- Customer experience, CSAT, NPS, Customer Effort Score, sentiment and emotion
- Operations, FCR, AHT, service level, abandonment, QA, compliance
- AI and automation, containment, intent accuracy, ASR quality, agent assist acceptance, hallucination and safety rates
When these layers are instrumented and reviewed on a clear cadence, leaders can spot leading indicators, intervene earlier, and coach skills that move the numbers.
The metrics that matter in 2025
Targets vary by industry and channel mix. Use the definitions, formulas, and action levers below to standardize how your organization measures and improves.
| Metric | What it measures | How to calculate | Use it to |
|---|---|---|---|
| First Contact Resolution (FCR) | Resolution quality without repeat contact | Resolved on first contact divided by total resolved | Identify knowledge gaps, process defects, and training opportunities that reduce repeat volume |
| Customer Satisfaction (CSAT) | Customer‑reported satisfaction after support | Positive responses divided by total responses | Track outcome quality by queue or topic, validate impact of process changes |
| Customer Effort Score (CES) | Ease of getting an issue resolved | Low‑effort responses divided by total responses | Prioritize friction removals, great for digital self‑service design |
| Containment Rate | Automation ability to resolve without agent | Automated resolutions divided by total automated contacts | Quantify bot and IVR ROI, focus design on high‑value intents |
| Average Handle Time (AHT) | Agent efficiency per contact | Talk time plus hold plus after call work | Balance efficiency with FCR and CSAT, spot knowledge or tooling friction |
| Service Level (SL) | Accessibility of live support | Percent of contacts answered within threshold | Ensure staffing and routing meet demand patterns |
| Abandonment Rate | Customers who leave before being answered | Abandoned calls divided by offered calls | Reduce wait times, offer callbacks, fix IVR dead ends |
| QA Score and Coverage | Interaction quality and how much you measure | Average QA score and percent of interactions scored | Calibrate human and auto‑QA, tie feedback to coaching |
| Compliance Breach Rate | Regulatory and policy adherence | Breaches divided by total interactions | Reduce risk, focus coaching on disclosure and redaction |
| Forecast Accuracy (MAPE) | Workforce planning effectiveness | Mean absolute percentage error | Adjust staffing, seasonality models, and shrinkage assumptions |
| Schedule Adherence | Agent time alignment to plan | Time in adherence divided by scheduled time | Improve occupancy without overloading agents |
| Digital Self‑Service Success | Portal or help content effectiveness | Self‑service solves divided by total self‑service attempts | Prioritize content and flow improvements by intent |
| Transfer Rate | Routing quality and first‑line capability | Transfers divided by total answered | Tighten routing rules, broaden tier‑1 skill, improve knowledge |
| Escalation Rate | Supervisory workload and policy limits | Escalations divided by total answered | Tune policies and empower agents with clearer guardrails |
| Revenue per Contact or Conversion Rate | Sales and save performance | Revenue or conversions divided by contacts | Align offers, pricing, and objection handling by segment |
2025 AI and generative CX quality metrics
As AI handles more intent detection, summarization, and even full resolutions, you need quality and risk metrics specific to the models and guardrails you run.
| AI Metric | What it measures | How to calculate | Use it to |
|---|---|---|---|
| Bot Resolution Rate | Successful automated resolutions | Automated resolutions divided by automated sessions | Prove value and target new intents |
| Intent Recognition Accuracy | Classification quality | Correct intents divided by total labeled intents | Improve training data and taxonomy |
| ASR Word Error Rate (WER) | Speech‑to‑text quality | Substitutions plus insertions plus deletions divided by total words | Choose microphones, tune acoustic models, reduce crosstalk |
| Agent Assist Acceptance Rate | Relevance of AI suggestions | Accepted suggestions divided by suggested | Trim noisy prompts, improve retrieval and timing |
| Hallucination Rate | Unsafe or incorrect AI content | Flagged hallucinations divided by AI responses | Strengthen retrieval grounding and safety filters |
| Toxicity and Safety Flag Rate | Harmful content prevention | Flagged toxic outputs divided by AI responses | Monitor guardrails, escalate for review |
Pro tip, pair every AI outcome metric with a precision and recall check against a human‑scored sample. That keeps automation from quietly drifting.
Make metrics drive decisions, a 90‑day playbook
- Align on business outcomes first, pick two or three north stars like cost per resolution, retention rate, revenue per contact.
- Standardize definitions, publish a one‑page glossary for FCR, AHT, SL, abandonment, and AI terms so every dashboard means the same thing.
- Instrument every channel, voice, chat, email, social, bots, and ensure timestamped events so you can calculate queue and resolution time consistently.
- Calibrate QA at scale, use auto‑QA for coverage and human QA for nuance, then compare scores monthly to reduce bias.
- Govern AI quality, track containment, intent accuracy, WER, hallucination and safety flags, and review changes behind a simple change log.
- Close the loop with skills training, when a metric dips, convert that insight into targeted practice, scenario‑based coaching, and certification.
Industry nuances to consider
- Financial services, heavier compliance and disclosure adherence scores should sit beside QA and CSAT in your executive view.
- Healthcare and wellness, beyond HIPAA safeguards, measure time to appointment, escalation to licensed clinician, and safety script adherence. Service providers that deliver care in the field, for example a provider of premium mobile IV therapy in Austin, depend on accurate scheduling, short response times, and clear pre‑screening disclosures, so their contact center and booking agents benefit from FCR, CES, and compliance metrics that are visible and coached weekly.
- B2B SaaS, track expansion opportunity rate inside support contacts, feature adoption mentions per interaction, and ticket deflection by knowledge article.
Turning insight into skill with scenario‑based training
Metrics expose gaps. Practice closes them. When FCR lags on a few top intents or AHT spikes on certain objections, targeted roleplay is the fastest path to behavior change.
Scenario IQ helps teams operationalize this loop with:
- AI‑powered roleplay simulations that mirror real customer scenarios by channel
- Personalized training scenarios and customizable skill levels that meet agents where they are
- Real‑time feedback and adaptive guidance so reps learn what good sounds like
- Progress tracking analytics and performance dashboards that make coaching measurable
- Team‑focused learning with daily actionable tips to keep improvements compounding
- Enterprise‑grade security so L&D and compliance teams can scale confidently
Tie the practice to the metric, for example, run a weekly simulation on your top three repeat‑contact intents, then watch FCR and CES for that intent cohort over the next two weeks. Use coaching notes and Scenario IQ progress trends to attribute what changed.
Common pitfalls and how to avoid them
- Chasing AHT in isolation, this often lowers FCR and CSAT. Balance speed with quality.
- Measuring too little, score more interactions with auto‑QA and sample deep with human QA for the highest risk or value intents.
- Fuzzy definitions, publish and enforce a glossary for SL, FCR, CES, and containment.
- AI without guardrails, track hallucination and safety flags, and keep human review for sensitive topics or regulated workflows.
- Insights with no practice plan, convert every major variance in your weekly review into a 2‑week practice and coaching sprint.
FAQ
What is the difference between FCR and containment rate? FCR measures whether a customer’s issue is resolved in a single contact, regardless of channel. Containment rate measures how many interactions were fully handled by automation without reaching a human. You can have high containment but low FCR if bots misclassify or hand off poorly.
How often should we recalibrate QA and auto‑QA? Do a monthly calibration across operations, QA, and training leaders. For auto‑QA, compare machine scores with a human‑scored sample, then adjust thresholds and rubrics to keep variance tight.
What is a healthy service level target? It depends on your industry, intent mix, and customer expectations. Pick a target that balances customer patience and cost, then prove it with CSAT and abandonment trends rather than chasing a generic 80 or 20 standard.
How do we measure AI hallucination rate in production? Start with human review on a labeled sample to define what counts as a hallucination. Then instrument safety filters and post‑interaction surveys, and track flagged hallucinations divided by AI responses. Review deltas after any prompt or model update.
Which training metrics correlate most with FCR gains? Time to proficiency on top intents, simulation pass rate by scenario, and post‑coaching performance delta are strong leading indicators. When these move up, FCR and CES usually follow for those intents.
How do we set targets without reliable benchmarks? Use your last 13 weeks as a baseline. Set directional goals per intent or queue, for example, plus 3 points CSAT or minus 10 percent AHT for billing calls, then validate with customer outcomes.
Bring your metrics to life with targeted practice
If you want your dashboards to move, your people need a faster way to practice the exact conversations that change the numbers. Scenario IQ combines AI‑powered roleplay simulations, real‑time feedback, and performance analytics so managers can turn insights into repeatable behaviors.
Ready to see how targeted scenario practice can lift FCR, CSAT, and conversion while keeping compliance tight? Visit Scenario IQ to request a walkthrough and explore how teams use adaptive simulations and team‑focused learning to improve the metrics that matter in 2025.