

Forecasts rarely fail because a team “can’t do math.” They fail because the inputs are weak, late, or biased. AI sales forecasting can dramatically improve accuracy, but only when it is fed better signals than the usual stage, amount, and rep gut feel.
This guide breaks down what “better signals” actually means, which signals tend to move the needle, and how RevOps and sales leaders can operationalize AI forecasts without creating a black box nobody trusts.
What AI sales forecasting is (and what it is not)
At its core, AI sales forecasting uses statistical and machine learning models to predict future revenue outcomes, typically by learning patterns from historical data such as pipeline movement, win rates, deal cycle length, and rep activity.
It is not a magic replacement for:
- A clear definition of sales stages and exit criteria
- Clean CRM hygiene
- Real pipeline inspection
- Strong enablement and coaching
Think of AI as a force multiplier. If your pipeline data is noisy, your forecast will be a faster, more confident version of the same noise.
Why traditional forecasts drift (even with great reps)
Most organizations start forecasting with a handful of fields: stage, close date, amount, and a probability that is often fixed (or manually adjusted). That approach breaks down for predictable reasons:
Stage probability is an oversimplification
Two deals in the same stage can have very different realities. One has an identified economic buyer and a clear mutual close plan, the other is “hope-ium” with a friendly champion.
Close dates slip more than teams admit
Close dates tend to be optimistic placeholders. Slippage is a signal, but many teams treat it as a cosmetic fix (“push it to next month”) rather than a predictive feature.
Rep commits can be biased
Humans anchor, sandbag, and react to incentives. This is not a character flaw, it is normal behavior. But it means the forecast input is not purely objective.
Late-stage deal risk often shows up outside the CRM
Pricing objections, procurement friction, legal redlines, stakeholder churn, and competitive pressure show up in emails, calls, and meetings before they show up in a tidy field.
Better forecasting accuracy comes from capturing these realities as signals early, consistently, and at scale.
The “better signals” mindset: leading indicators beat lagging indicators
Most CRM fields are lagging indicators. Stage changes and updated probabilities usually happen after momentum has already shifted.
“Better signals” are often leading indicators that tell you what is likely to happen next, even when the stage has not changed.
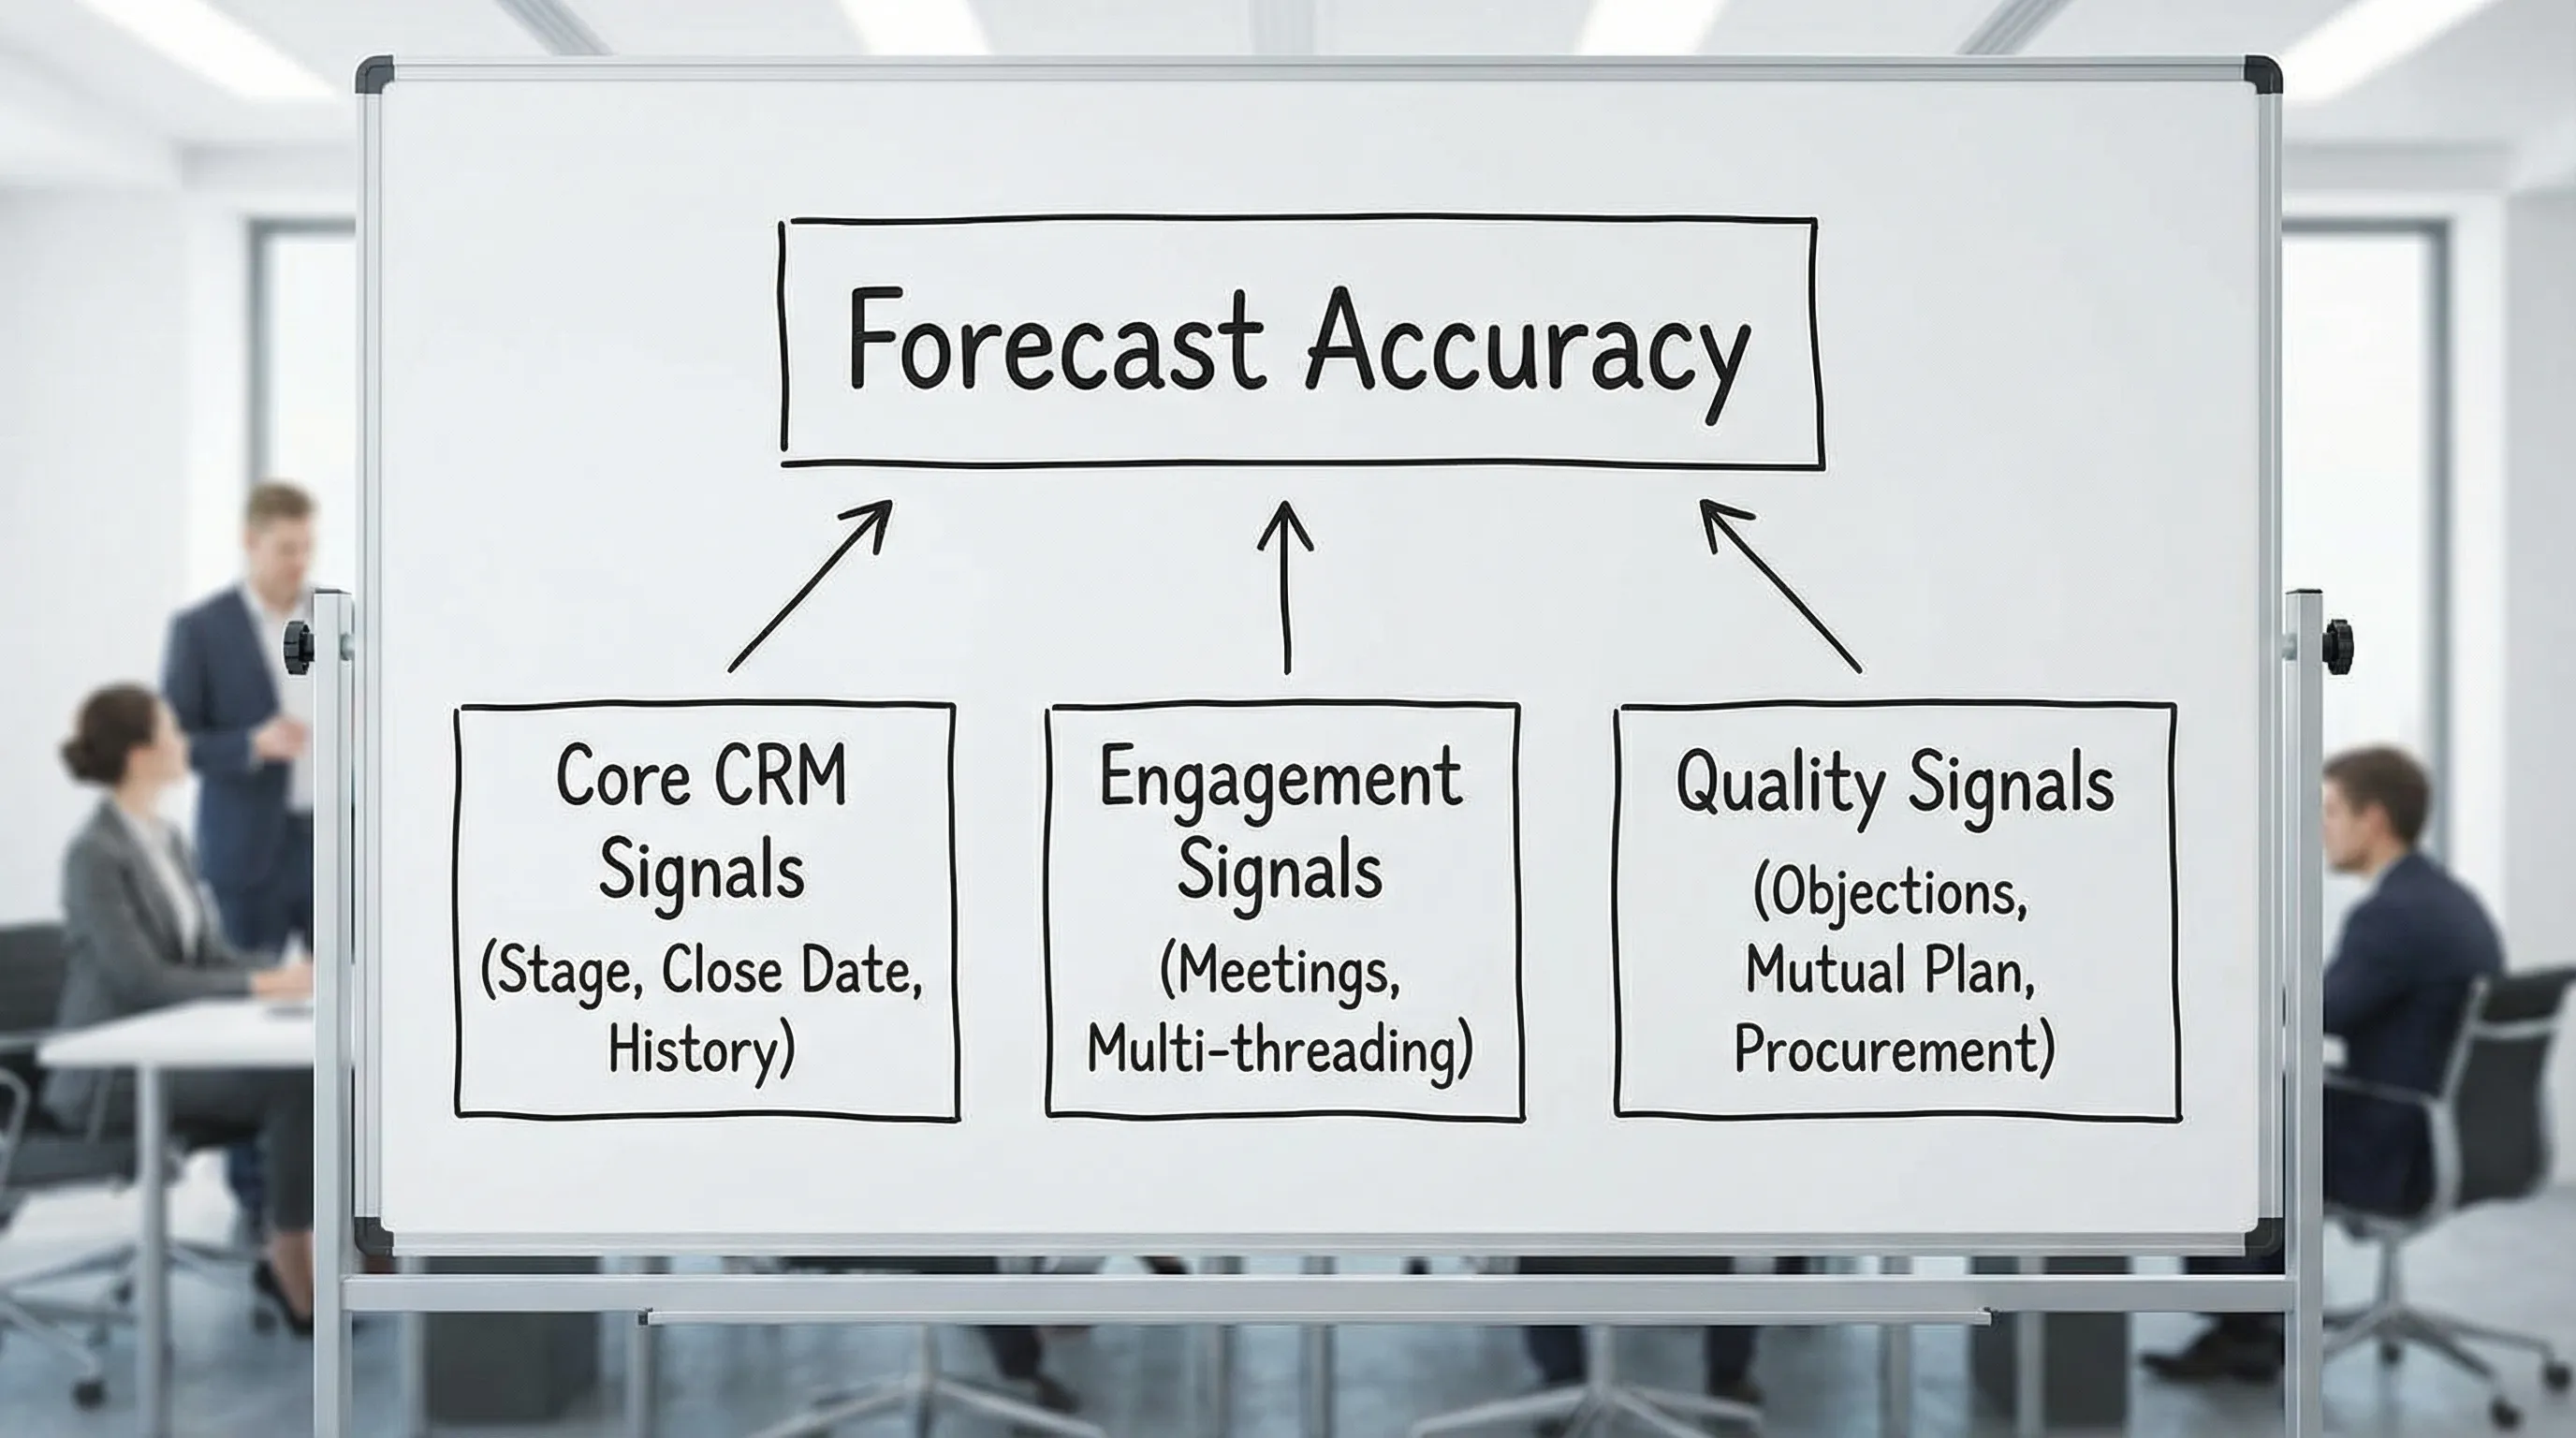
Here is a practical way to think about the signal stack.
| Signal category | Examples of signals | Why it improves forecast accuracy | Common pitfall |
|---|---|---|---|
| Pipeline structure (core CRM) | Stage history, close-date changes, amount changes, time-in-stage | Models learn patterns like slippage, stall risk, and stage conversion rates by segment | Overwriting history (no audit trail) makes learning harder |
| Engagement and activity | Meeting count and recency, multi-threading, response time, sequence outcomes | Momentum is measurable, deal velocity often correlates with consistent buyer engagement | Counting raw activity (busywork) instead of buyer activity |
| Buyer intent and content behavior | Web visits, pricing page views, high-intent content, event attendance | Adds “interest strength” signals that appear before pipeline movement | Attribution gaps and noisy identity matching |
| Conversation quality | Objection themes, next-step clarity, stakeholder alignment, competitive mentions | Captures the real reasons deals win or slip, often earlier than stage changes | Treating sentiment as truth without context |
| Commercial process signals | Mutual action plan adoption, procurement steps started, legal cycle initiated | Procurement and legal are predictable sources of delay, explicit signals improve timing forecasts | Process steps tracked inconsistently across reps |
| Product and service signals (when relevant) | Trial usage depth, activation milestones, POC success criteria met, support escalation | Especially strong for PLG, trials, and expansions, usage predicts conversion and churn | Using vanity usage metrics instead of milestone completion |
| People and enablement signals | Rep ramp stage, coaching cadence, skill proficiency indicators, deal review compliance | Forecast risk differs by rep maturity and execution quality, not just pipeline | Confusing tenure with competency |
| External context | Seasonality, territory changes, pricing changes, macro events | Prevents “model surprise” when conditions change materially | Overfitting to rare events |
You do not need every category to see improvement. Many teams get a step-change simply by tracking close-date movement, time-in-stage, and a few quality signals that reflect real buying progress.
Which signals tend to matter most in B2B sales
While every go-to-market motion is different, these signal patterns are consistently useful across many B2B teams.
1) Close-date movement (slippage) as a first-class feature
Instead of asking “What is the close date?”, track:
- How often the close date changes
- How far it moves each time
- Whether it moves forward (rare) or backward (common)
A deal that keeps slipping without a documented reason is fundamentally different from a deal whose date moves once due to a known procurement window.
2) Time-in-stage relative to the deal’s peer group
Time-in-stage becomes powerful when compared to the right baseline. “14 days in Discovery” might be fine for SMB and alarming for Enterprise, or the opposite.
Segment baselines by factors like:
- Deal size band
- Segment (SMB, mid-market, enterprise)
- Product line
- Industry
- Sales motion (inbound, outbound, partner)
3) Multi-threading and stakeholder coverage
AI models love measurable proxies for “risk.” One of the simplest is whether the deal is single-threaded.
Examples of stakeholder coverage signals include the number of distinct stakeholders engaged, role diversity (economic buyer, champion, technical approver), and whether meetings include decision-makers.
4) Commercial milestones, not “good vibes”
Forecast calls often revolve around optimism. Better signals revolve around milestones.
Milestone examples:
- Business problem quantified and agreed
- Success criteria documented
- Mutual action plan accepted
- Security review initiated
- Legal redlines received
- Procurement process confirmed
Even if you do not have all of these captured perfectly, adding two or three milestone checkpoints can improve both forecast accuracy and sales execution.
5) Conversation-based signals (used carefully)
Conversation intelligence and structured call notes can surface leading indicators like:
- Repeated objections (price, security, integration, change management)
- Competitive mentions
- Ambiguous next steps (“we’ll get back to you”) versus scheduled next meeting
- Stakeholder misalignment
The caution: signals need grounding. A model should not treat “positive sentiment” as a win predictor if the next step is unclear or procurement has not started.
Building an AI forecast that leaders actually trust
Accuracy alone is not enough. If sales leadership cannot explain the forecast, it will be ignored.
Start with the business question, not the model
Define:
- Forecast target (bookings, revenue, ARR, renewals)
- Horizon (weekly, monthly, quarterly)
- Granularity (company, region, segment, rep)
- Output format (a number, a range, and drivers)
A forecast that includes a range (for example, most-likely with upside and downside) is often more actionable than a single point estimate.
Use backtesting and simple benchmarks
Before celebrating AI, compare it to baselines you already use (stage-weighted, rep commit, simple historical averages). Backtest on previous quarters.
Common evaluation metrics include:
| Metric | What it measures | Why it matters |
|---|---|---|
| MAE (Mean Absolute Error) | Average absolute error in forecast | Easy to interpret in dollars |
| MAPE (Mean Absolute Percentage Error) | Error as a percentage | Helpful across segments with different deal sizes |
| Bias | Systematic over-forecasting or under-forecasting | Prevents “always optimistic” models |
If the AI model is only marginally better than a simple baseline, the answer is often not a fancier algorithm. It is better signals and better governance.
Prioritize explainability and drivers
Leaders want to know “why.” The most adopted AI forecasts typically provide drivers such as:
- Key risk signals (slippage, stalled stage, single-threaded)
- Key strength signals (procurement started, mutual plan confirmed)
- Similar historical deal patterns
If your AI forecast cannot produce understandable drivers, adoption will suffer, even if it is statistically strong.
Practical ways to improve signals without boiling the ocean
You can often improve forecasting accuracy within one quarter by tightening a few operational habits.
Tighten CRM definitions (especially stages)
Stages should reflect buyer progress, not seller activity. Add simple exit criteria and enforce them in pipeline reviews.
Preserve history wherever possible
AI needs historical movement. If your systems overwrite fields without keeping change history, you lose predictive power.
Track “next step scheduled” as a binary signal
One of the most underused quality signals is whether a concrete next meeting is on the calendar with the right stakeholders.
Make deal reviews evidence-based
Encourage reps to anchor updates in evidence: mutual action plan, stakeholder alignment, procurement timeline, and explicit risks.
Data governance, privacy, and security considerations
Forecasting touches sensitive data: customer information, pricing, call transcripts, and performance data. Any AI initiative should include:
- Data minimization (only collect what you need)
- Access controls by role
- Retention policies
- Clear rules for using conversation data
- Vendor security reviews (especially for enterprise environments)
For organizations building internal AI systems, frameworks like the NIST AI Risk Management Framework can be a useful reference for governance discussions.
A commonly missed signal: sales readiness and execution quality
Forecasting is not only about the buyer. It is also about the seller’s ability to execute consistently.
Two pipelines can look identical in the CRM, yet perform differently because:
- One team handles objections confidently
- One team runs discovery with consistent rigor
- One team can navigate procurement and legal smoothly
This is where enablement signals become powerful leading indicators. If you can quantify improvements in deal execution (objection handling, discovery quality, next-step discipline), you can often improve both win rates and forecast stability.
How Scenario IQ can support better forecasting inputs (without being a forecasting tool)
Scenario IQ focuses on AI roleplay training for sales and service teams, using personalized scenarios, real-time feedback, and analytics. While Scenario IQ is not positioned as a sales forecasting platform, it can help create more reliable upstream signals by improving execution consistency.
Examples of enablement signals that can strengthen your overall revenue predictability include:
- Skill proficiency trends over time (by team, region, or role)
- Common objection categories where reps struggle (and improve)
- Coaching impact signals tied to scenario performance
When seller behavior becomes more consistent, your pipeline becomes less volatile, and forecasting inputs become more trustworthy. If you want a practical way to strengthen those upstream signals, explore Scenario IQ to see how AI roleplay training can improve confidence and execution in the moments that decide deals.
What to do next: a simple roadmap
If your goal is “AI sales forecasting that executives trust,” focus on sequencing.
Phase 1 (2 to 4 weeks): Clean up and instrument the basics
Focus on close-date history, stage history, and consistent stage definitions. Add one or two quality checkpoints.
Phase 2 (1 to 2 quarters): Add leading indicators
Layer in stakeholder coverage, milestone tracking, and conversation-based signals if governance allows.
Phase 3 (ongoing): Operationalize insights
Build a rhythm where forecasting is not just a number, it is a set of actions. For example, “top 20 at-risk deals with the two strongest drivers” is often more useful than another spreadsheet.
Accurate forecasting is less about finding a perfect model and more about building a reliable signal system. Once the signals improve, AI can do what it does best: detect patterns consistently, earlier than humans, and at a scale humans cannot match.