

Most marketing dashboards look busy and still fail to answer the only question that matters to revenue leaders: what is actually moving pipeline? Clicks, impressions, and even MQL volume can be useful diagnostics, but they are not outcomes. AI marketing analytics is valuable when it helps you connect signals to sales conversations, opportunity creation, and wins, then tells you what to do next.
This guide explains how to structure AI-driven measurement around pipeline impact, which metrics to elevate (and which to demote), and how to operationalize insights across marketing, sales, and service.
What “pipeline-moving” marketing analytics really means
“Pipeline-moving” analytics ties marketing activity to verifiable progression through your revenue funnel, not just platform engagement. In B2B, that usually means movement from known demand to revenue events such as:
- Sales accepted leads (or qualified meetings)
- Opportunities created
- Pipeline value influenced (with clear rules)
- Stage progression (for example, discovery to proposal)
- Closed-won revenue
- Retention or expansion (for existing customers)
A practical way to keep teams aligned is to define one shared funnel and one shared vocabulary across marketing and sales (lifecycle stages, timestamps, ownership rules).
| Funnel stage | What to measure | Why it matters | What AI can add |
|---|---|---|---|
| Demand capture | High-intent actions (demo requests, pricing views, event meetings set) | Strongest early indicator of pipeline | Propensity scoring, intent clustering, anomaly detection |
| Qualification | Sales acceptance, meeting held rate, qualification pass rate | Separates volume from quality | Predict which leads will convert, flag low-quality sources |
| Opportunity creation | Opps created, opp value, product fit tags | The handoff becomes real pipeline | Forecast opp creation by channel and segment |
| Stage progression | Time in stage, conversion by stage, slip rate | Shows if marketing is attracting the right buyers | Identify which messages correlate with faster progression |
| Closed-won | Revenue, win rate, sales cycle length | Final proof of impact | Predict win probability, explain drivers, identify objections |
Vanity metrics vs pipeline metrics (and what to do with each)
Vanity metrics are not “bad”, they are incomplete. The issue is using them as success criteria instead of as supporting signals.
| Category | Vanity metrics (supporting) | Pipeline metrics (primary) | Better question to ask |
|---|---|---|---|
| Awareness | Impressions, reach, follower growth | Lift in branded search, direct traffic to high-intent pages, account engagement | “Did awareness translate into identifiable demand?” |
| Engagement | CTR, time on page, video views | Conversion to intent actions, meeting set rate | “Did engagement predict qualification?” |
| Lead gen | MQL volume, CPL | SAL rate, meeting held rate, opp creation rate | “Did leads become sales conversations?” |
| Revenue | Influenced pipeline (uncontrolled) | Sourced pipeline with strict rules, incremental lift, CAC payback | “What revenue would not exist without this spend?” |
Recommendation: Keep vanity metrics in diagnostic views (for creative and channel health), but set goals and budget decisions on pipeline metrics.
Where AI marketing analytics helps (beyond prettier dashboards)
AI becomes genuinely useful when it improves one of these three capabilities:
1) Measurement you can trust
Modern journeys are messy (multiple devices, privacy constraints, walled gardens, long sales cycles). AI can help reconcile data and detect issues, but only if you define rules.
Examples of high-value AI applications:
- Identity and deduplication support (within your compliance rules) to reduce double counting
- Automated data quality checks (sudden conversion spikes, broken UTMs, form changes)
- Modeling missing signals (for example, forecasting likely source mix when tracking is partial)
For baseline measurement foundations, it is still worth aligning with established guidance like Google Analytics documentation on event design and data quality practices (see Google Analytics Help).
2) Diagnosis, not just reporting
AI can surface patterns humans miss, especially across segments and time.
Useful diagnostic outputs include:
- Which campaigns correlate with higher meeting-held rates, not just higher form fills
- Which content precedes faster stage progression
- Which segments show rising intent but falling qualification (often a positioning mismatch)
- Which channels drive lower objection density in sales calls (more on that below)
3) Actionable recommendations
The best AI marketing analytics systems do not stop at “what happened”. They suggest:
- Where to reallocate spend based on predicted opp creation and win probability
- Which messages to emphasize because they reduce time-to-close
- Which objections are increasing, so marketing can adjust claims and sales can prepare

A practical framework: build AI marketing analytics around pipeline (not platforms)
Start with a revenue-aligned “measurement contract”
Before you add AI, align stakeholders on a short set of definitions:
- What counts as sourced pipeline vs influenced pipeline
- Required timestamps (lead created, sales accepted, meeting held, opp created, stage changes)
- Ownership rules (when marketing hands off, when sales owns)
- The system of record for each entity (CRM for opps, product analytics for activation, etc.)
This reduces political dashboards where every team “wins” but revenue stays flat.
Choose 5 to 8 core metrics that map to decisions
If everything is a KPI, nothing is.
A solid core set for many B2B teams:
- Qualified meetings set (and held)
- Sales acceptance rate
- Opportunity creation rate
- Pipeline value created (with hygiene rules)
- Win rate by source and segment
- Sales cycle length by source and segment
- CAC payback (or contribution margin payback) at a cohort level
Then let AI expand into supporting metrics (creative fatigue, frequency caps, landing page diagnostics).
Treat attribution as a toolkit, not a religion
One reason vanity metrics persist is that teams do not trust revenue linkage. Attribution is hard, but you can make it usable by combining approaches.
| Approach | Best for | Strengths | Limitations |
|---|---|---|---|
| First-touch / last-touch | Fast directional reporting | Simple, stable | Over-credits a single moment |
| Multi-touch attribution (MTA) | Shorter, trackable journeys | More nuanced credit sharing | Sensitive to tracking loss and model assumptions |
| Marketing mix modeling (MMM) | Aggregate budget allocation | Works without user-level tracking | Less granular, needs time and spend variation |
| Incrementality tests (holdouts) | Proving causal lift | Closest to “would this exist otherwise?” | Requires design discipline, not always feasible |
How AI helps: it can automate model refreshes, detect when assumptions break, and propose test ideas (for example, where holdouts would be most informative).
If you want a strong overview of experimentation and causal inference concepts (incrementality, controls, uplift), Harvard Business Review has accessible primers (see HBR for experimentation articles).
Connect marketing signals to sales reality (calls, objections, outcomes)
Pipeline impact is not only about who converts, it is about how deals progress.
If you capture call notes, outcomes, or conversation intelligence summaries, you can analyze:
- Objections that spike after a new campaign promise
- Phrases that correlate with higher meeting-to-opp conversion
- Competitors mentioned more frequently (a positioning signal)
This is where marketing analytics becomes a revenue engine: insights turn into better messaging, enablement, and coaching.
How to operationalize: a weekly pipeline analytics cadence that actually changes behavior
AI marketing analytics delivers ROI when it changes decisions quickly.
Run a “Pipeline Impact Review” (30 to 45 minutes weekly)
Keep it tight and consistent:
- Pipeline created by source and segment (last 7 and 28 days)
- Meeting held rate and sales acceptance rate by source
- Top 3 anomalies (what changed, where, and why)
- 1 to 2 budget reallocations (small, reversible)
- 1 insight to feed sales enablement (objections, talk tracks, competitor shifts)
Use AI to generate testable hypotheses, then validate
A useful pattern is:
- AI flags a pattern (example: healthcare leads convert slower but win bigger)
- Team forms a hypothesis (example: messaging is too generic for compliance stakeholders)
- Run a targeted experiment (vertical landing page, tailored webinar)
- Measure impact on qualification and stage progression (not just CTR)
Close the loop with training and coaching
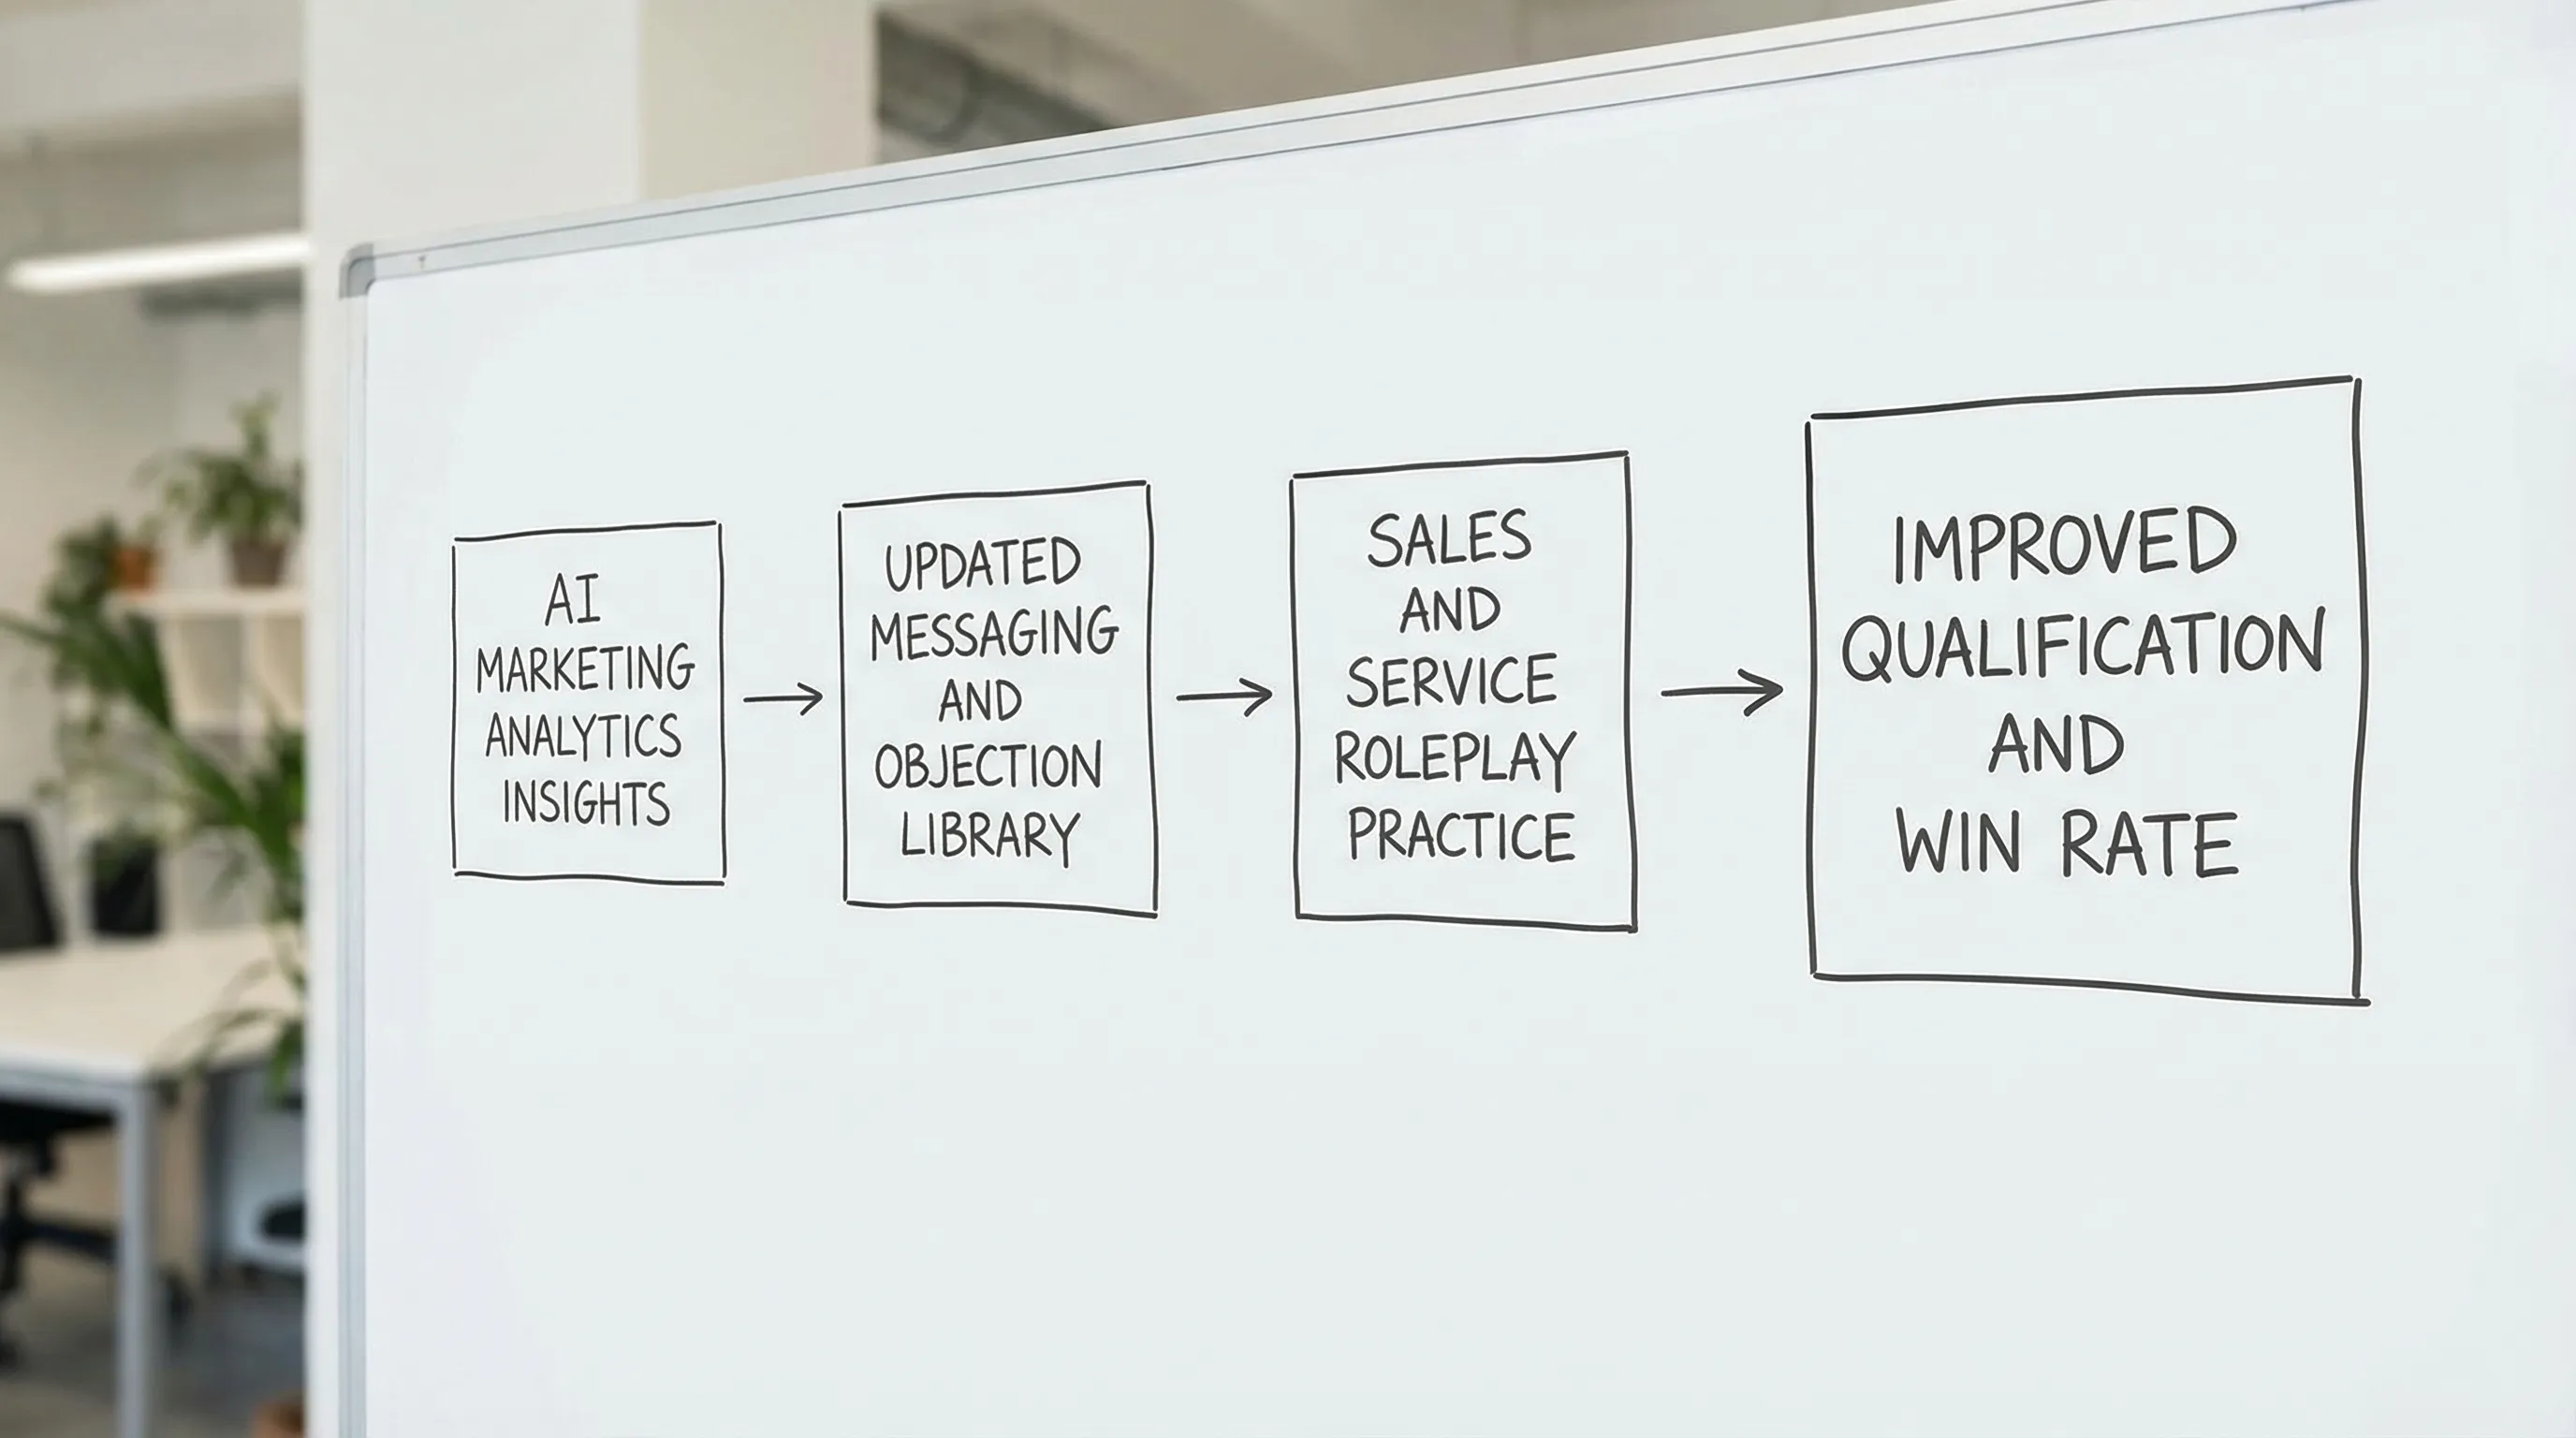
When analytics reveals which messages, objections, or scenarios are driving outcomes, you can turn them into practice, not just slides.
Scenario-based training is particularly effective here because it bridges the last mile between marketing insights and revenue performance. If your data shows an uptick in a specific objection (for example, “we are concerned about security”), you can translate that into consistent practice conversations for reps and customer-facing teams.
Common pitfalls that keep teams stuck in vanity reporting
Confusing “influenced pipeline” with impact
Influence can be useful for visibility, but it is easy to inflate. If leadership is making budget decisions, insist on at least one of:
- Strict sourced rules
- Incrementality testing where possible
- Cohort-based payback analysis
Letting platforms define success
Ad platforms optimize for their own proxy conversions. Your job is to re-optimize toward qualified conversations and revenue, even if that means fewer “leads.”
Not separating signal from noise in AI outputs
AI can confidently summarize bad data. Put guardrails in place:
- Monitor tracking changes (forms, UTMs, routing rules)
- Track lead routing latency (delays can destroy conversion)
- Require explainability for major budget shifts (what drove the recommendation?)
Frequently Asked Questions
What is AI marketing analytics? AI marketing analytics uses machine learning to analyze marketing and revenue data, find patterns, predict outcomes (like opp creation), and recommend actions.
How do I know if a metric is vanity or pipeline? If a metric cannot be tied to qualification, opportunity creation, stage progression, or revenue, it is supporting at best. Use it for diagnostics, not goals.
Do I need perfect attribution to measure pipeline impact? No. You need consistent definitions, clean CRM stage data, and a mix of methods (simple attribution, cohort analysis, and occasional incrementality tests).
What data should I prioritize first? Lifecycle timestamps (lead created, accepted, meeting held), opportunity creation and stages in your CRM, and a reliable way to connect campaigns to lead records.
How can AI help sales and marketing alignment? By linking campaign themes to downstream outcomes (objections, stage progression, win rates), AI helps both teams agree on what is working and what to change.
Turn pipeline insights into better conversations (and more wins)
AI marketing analytics is most powerful when it does more than report. The goal is to turn insights into behavior change across revenue teams.
Scenario IQ helps teams practice the exact conversations your analytics says matter most, from objection handling to qualification and customer interactions, using AI-powered roleplay and real-time feedback. If you want to connect marketing insights to confident execution in sales and service, explore Scenario IQ and see how scenario-based training can support measurable pipeline outcomes.